Reports and Publications

Report Design for UNIDO-MAGZI on Cameroon’s Economic Zones

Created in collaboration with SF-production agency
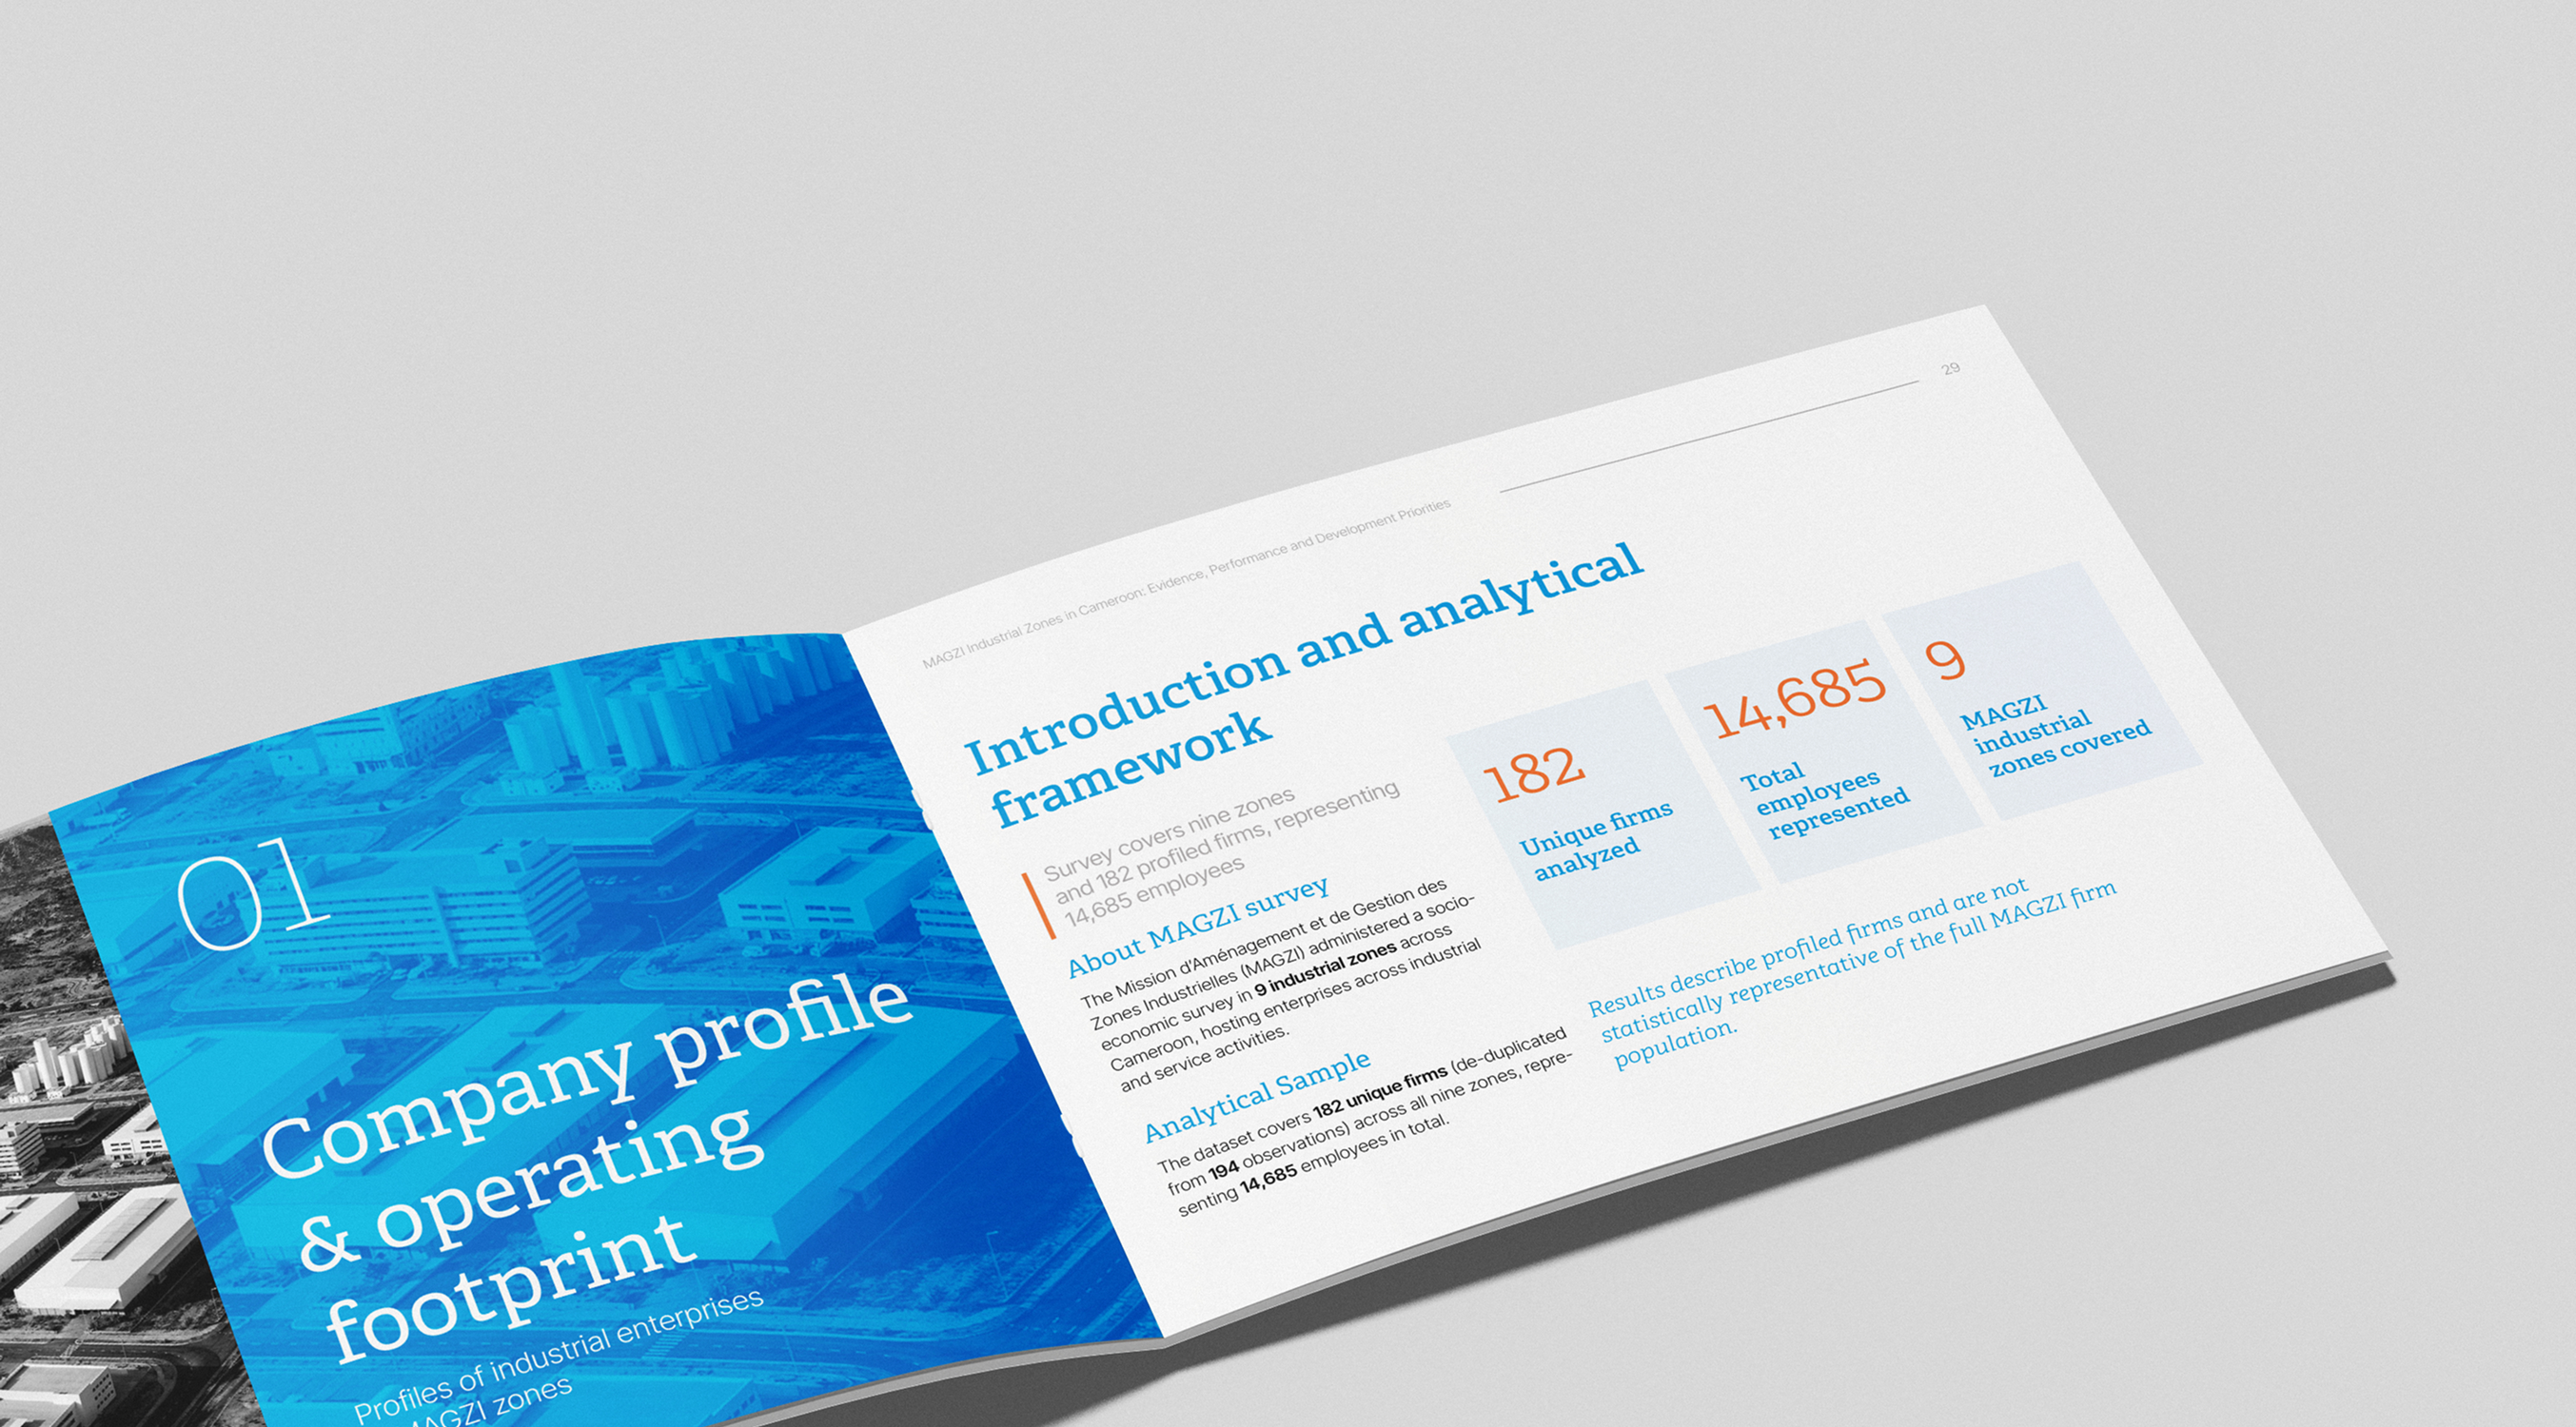
Open booklet titled 'MAGZI Industrial Zones in Cameroon: Evidence, Performance and Development Priorities' with findings from the UNIDO–MAGZI Socio-Economic Survey 2025, showing logos of UNIDO, MAGZI, European Union, and the Organisation of African, Caribbean and Pacific States.

Challenge

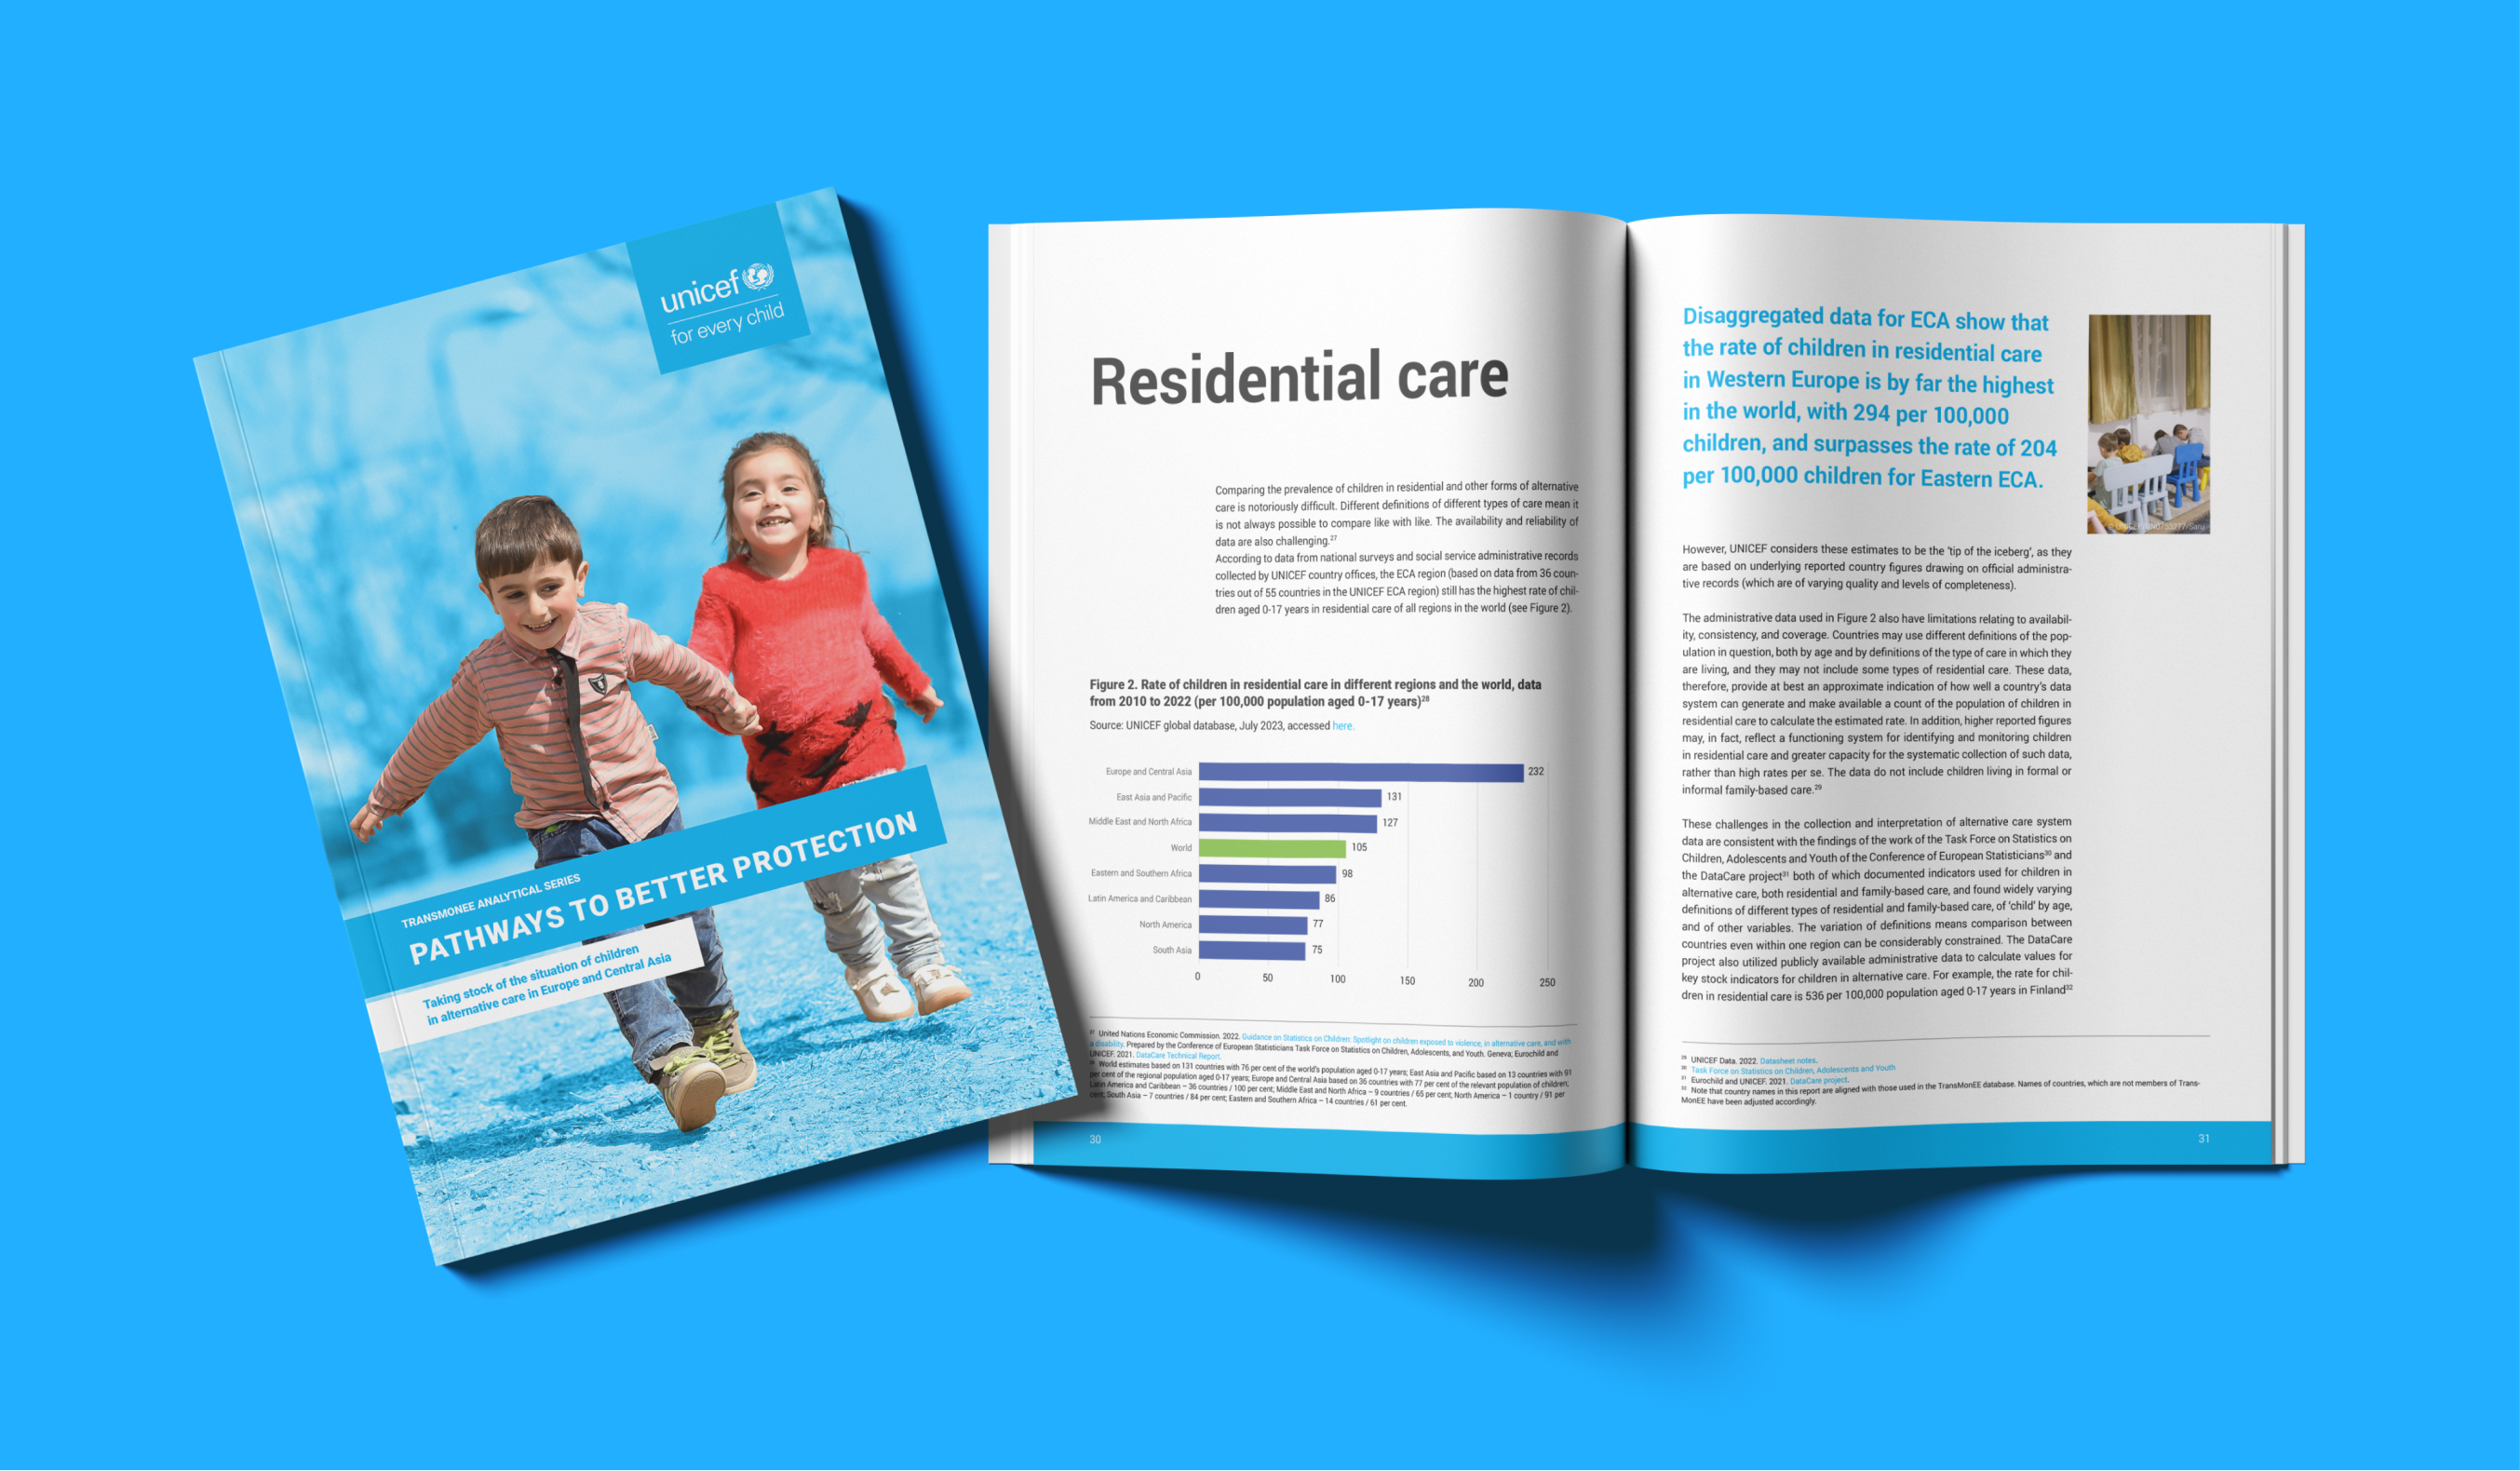
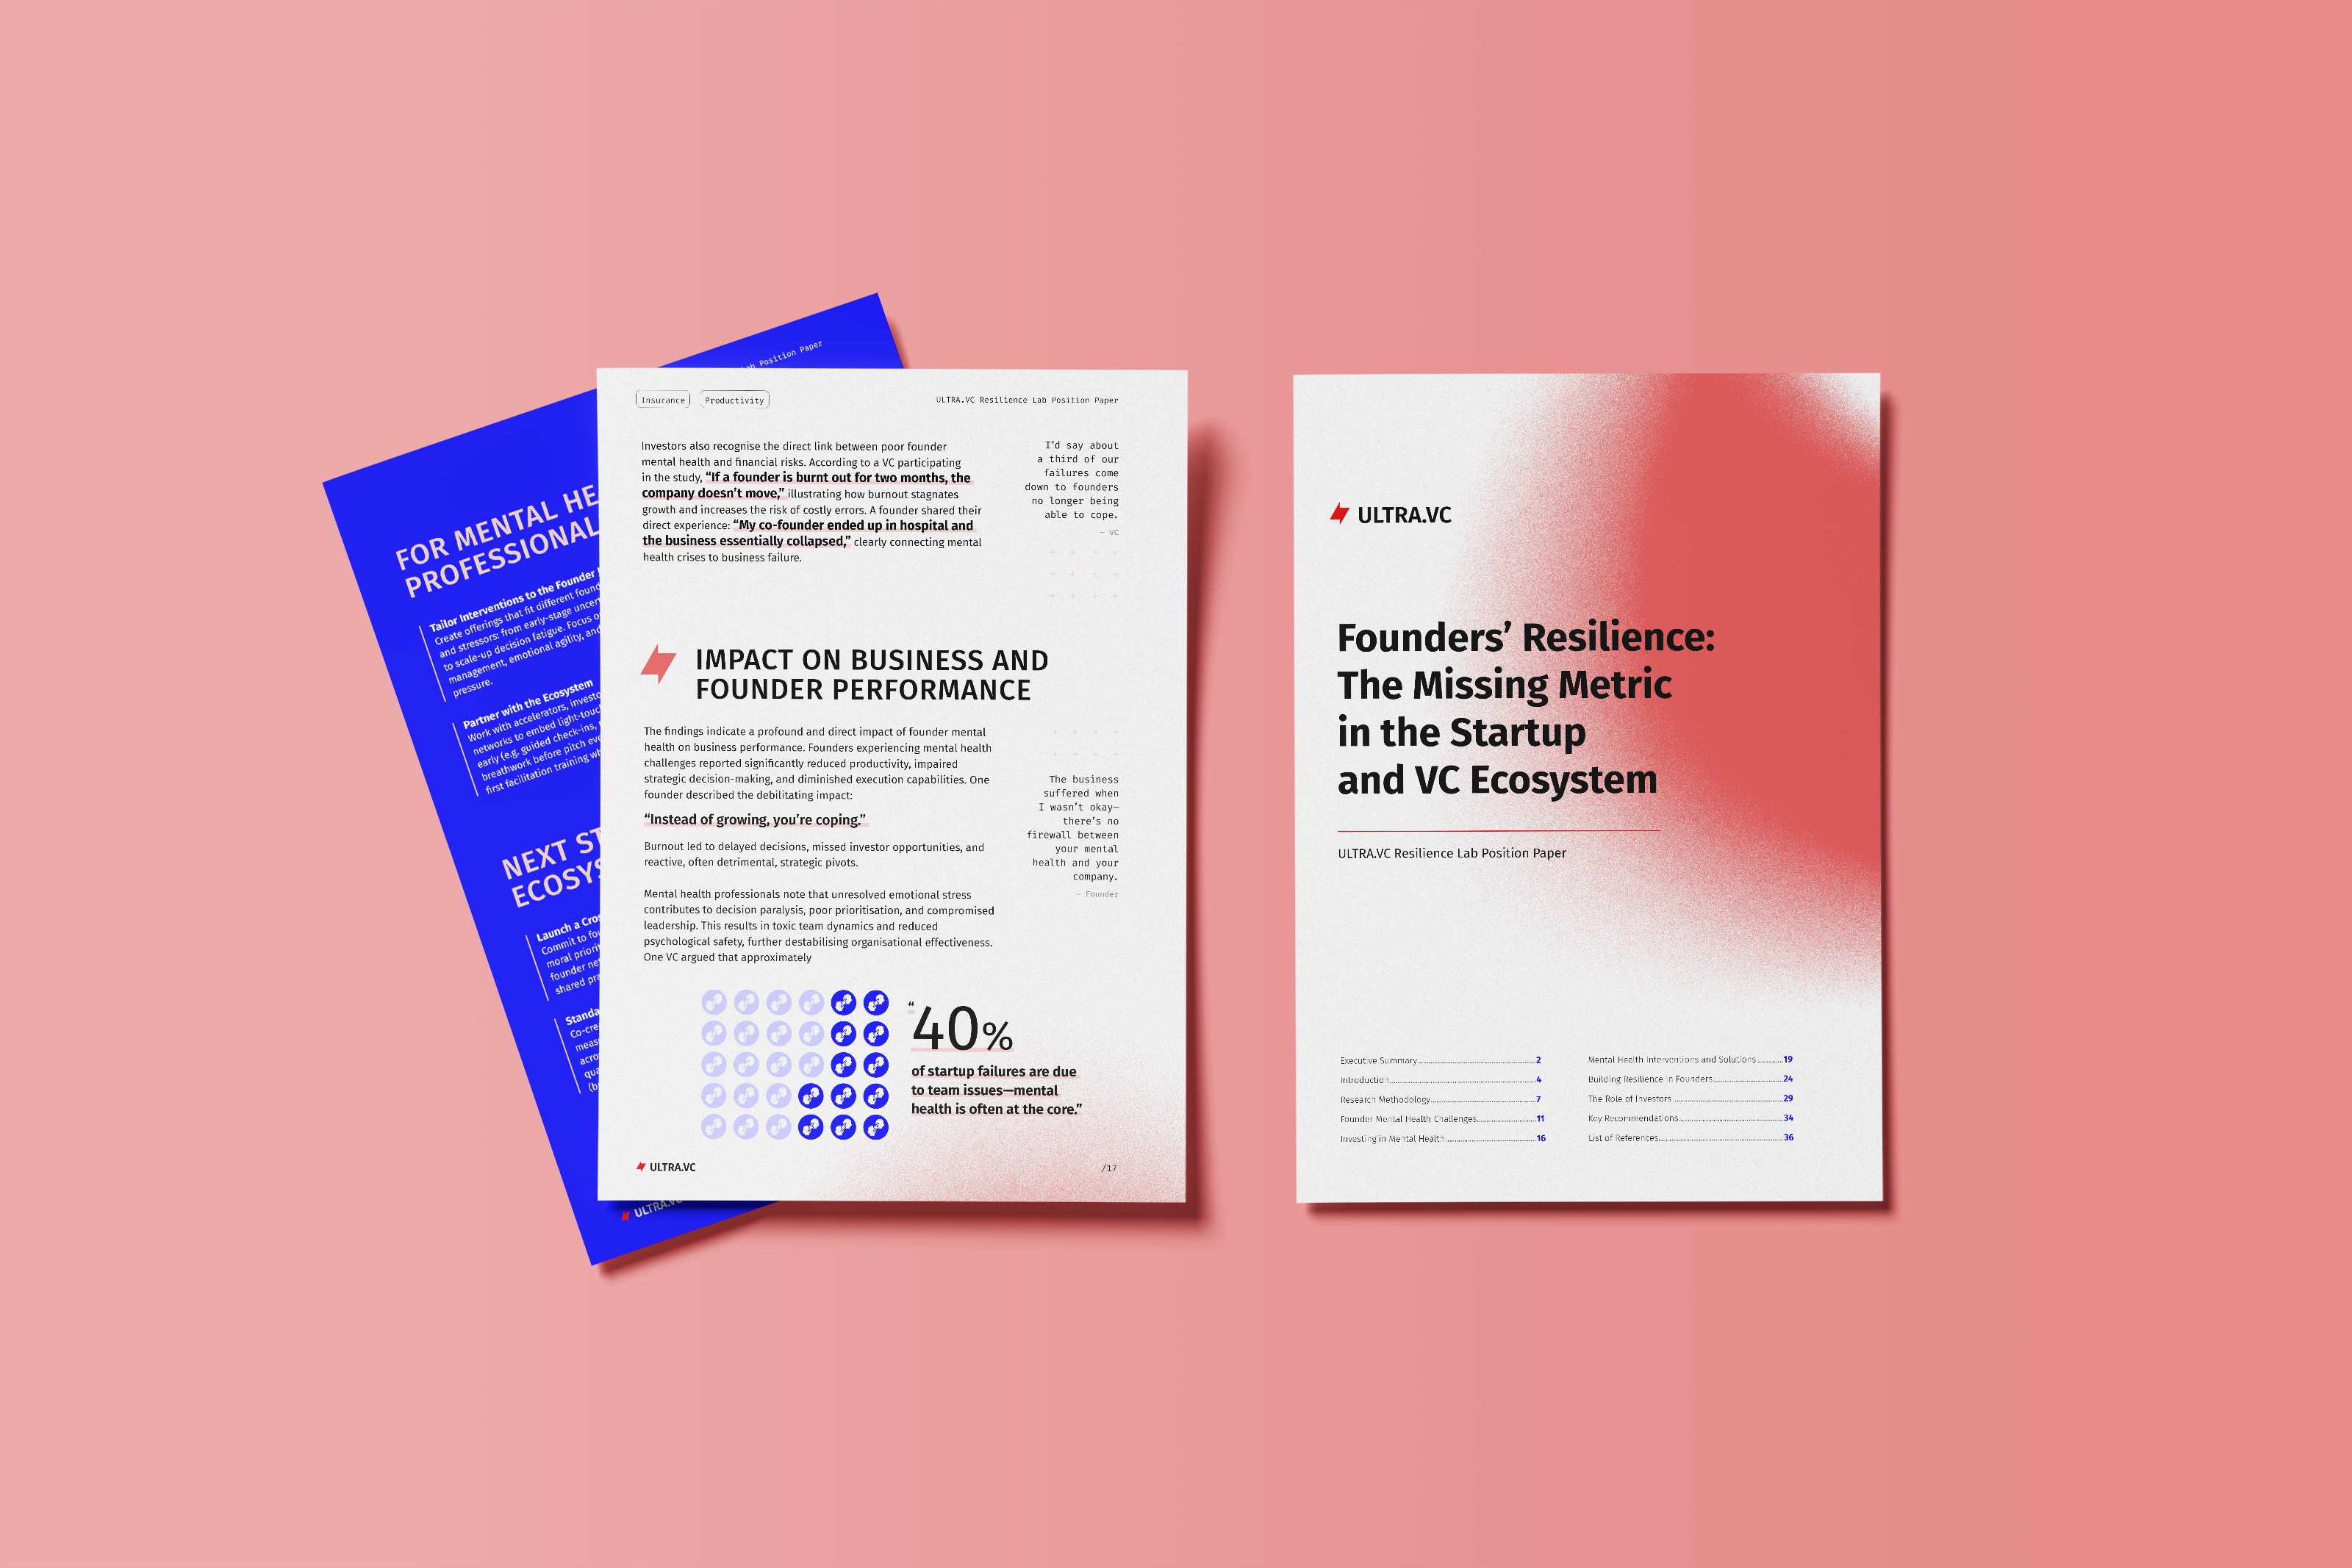
Complex tables and dense text were transformed into clear, engaging charts and infographics that present the latest data on Cameroon’s economic zones. The report was designed in compliance with UNIDO guidelines and delivered print-ready.

Services

  • Report design concept
  • Custom icons and data visualisations
  • Layout design
  • Print-ready files and print production guidelines
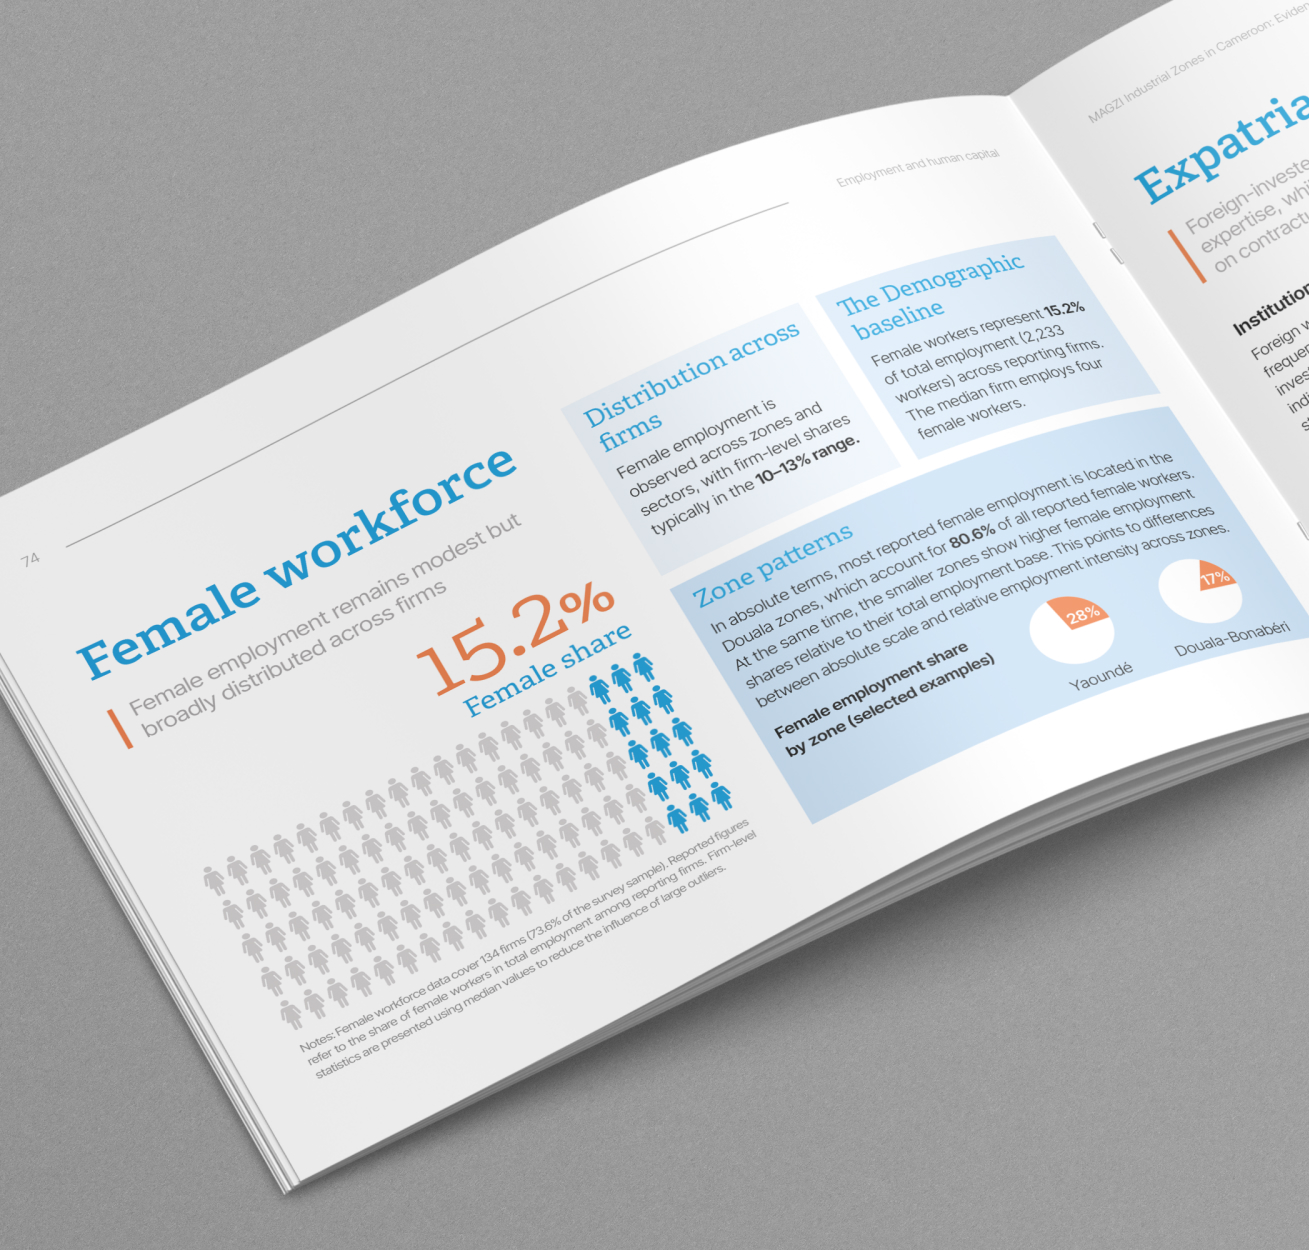
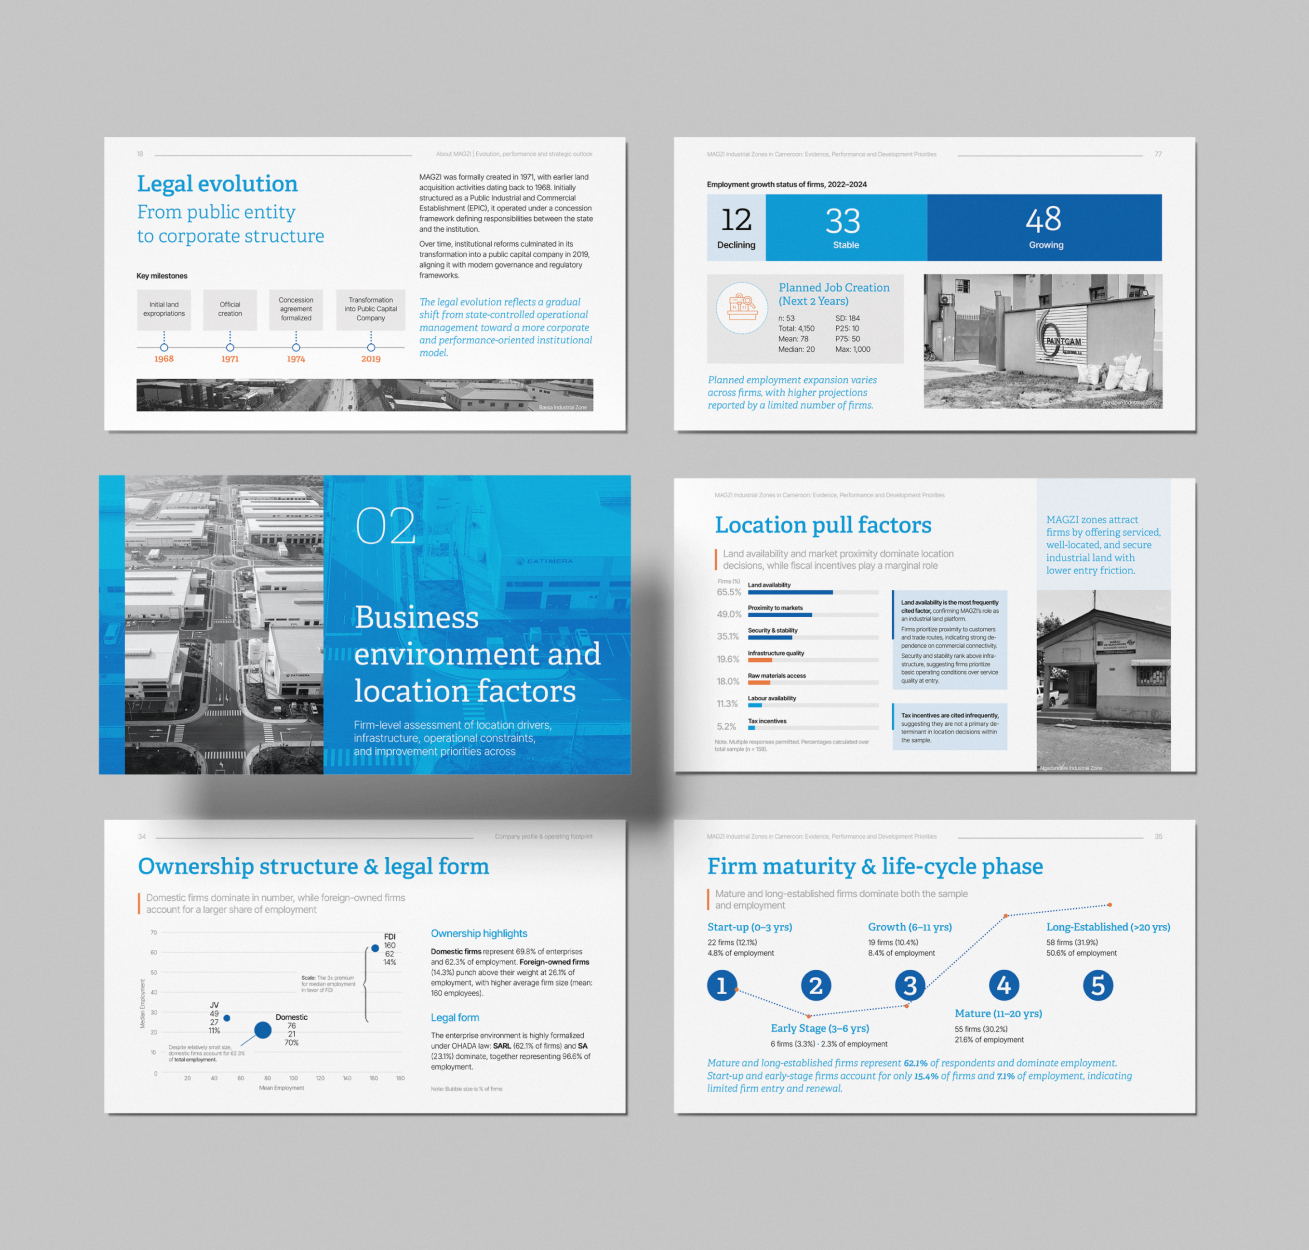
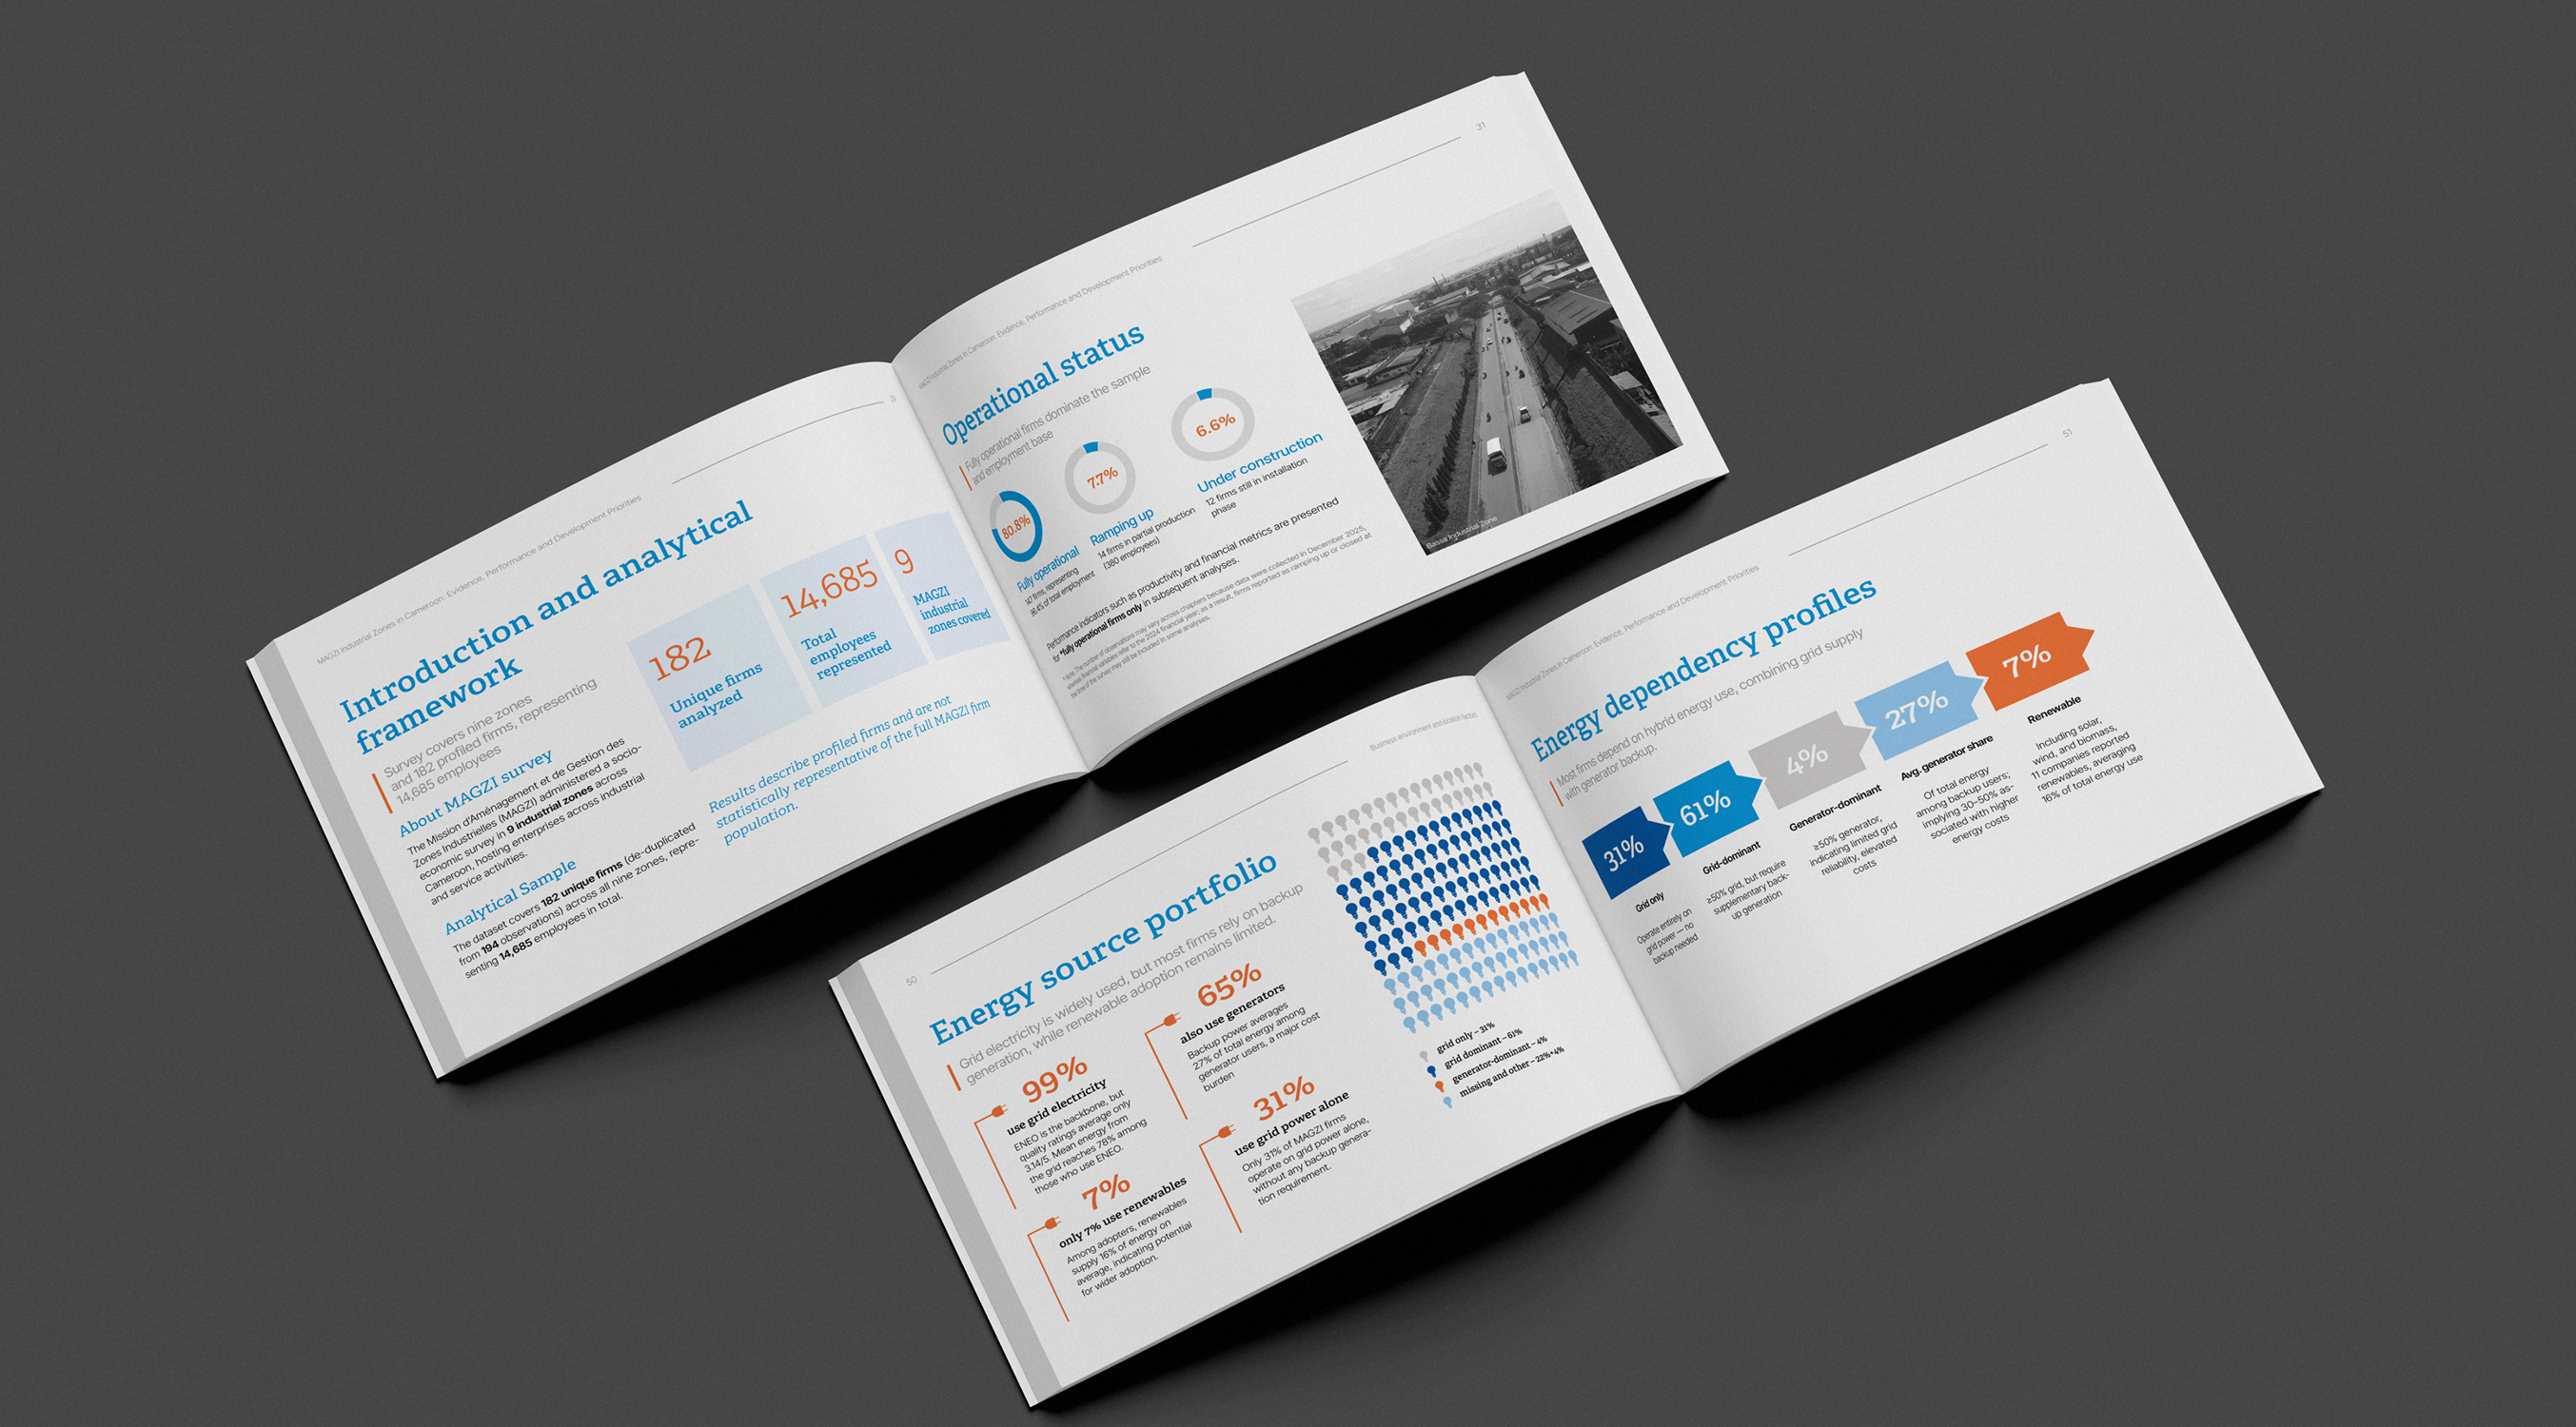
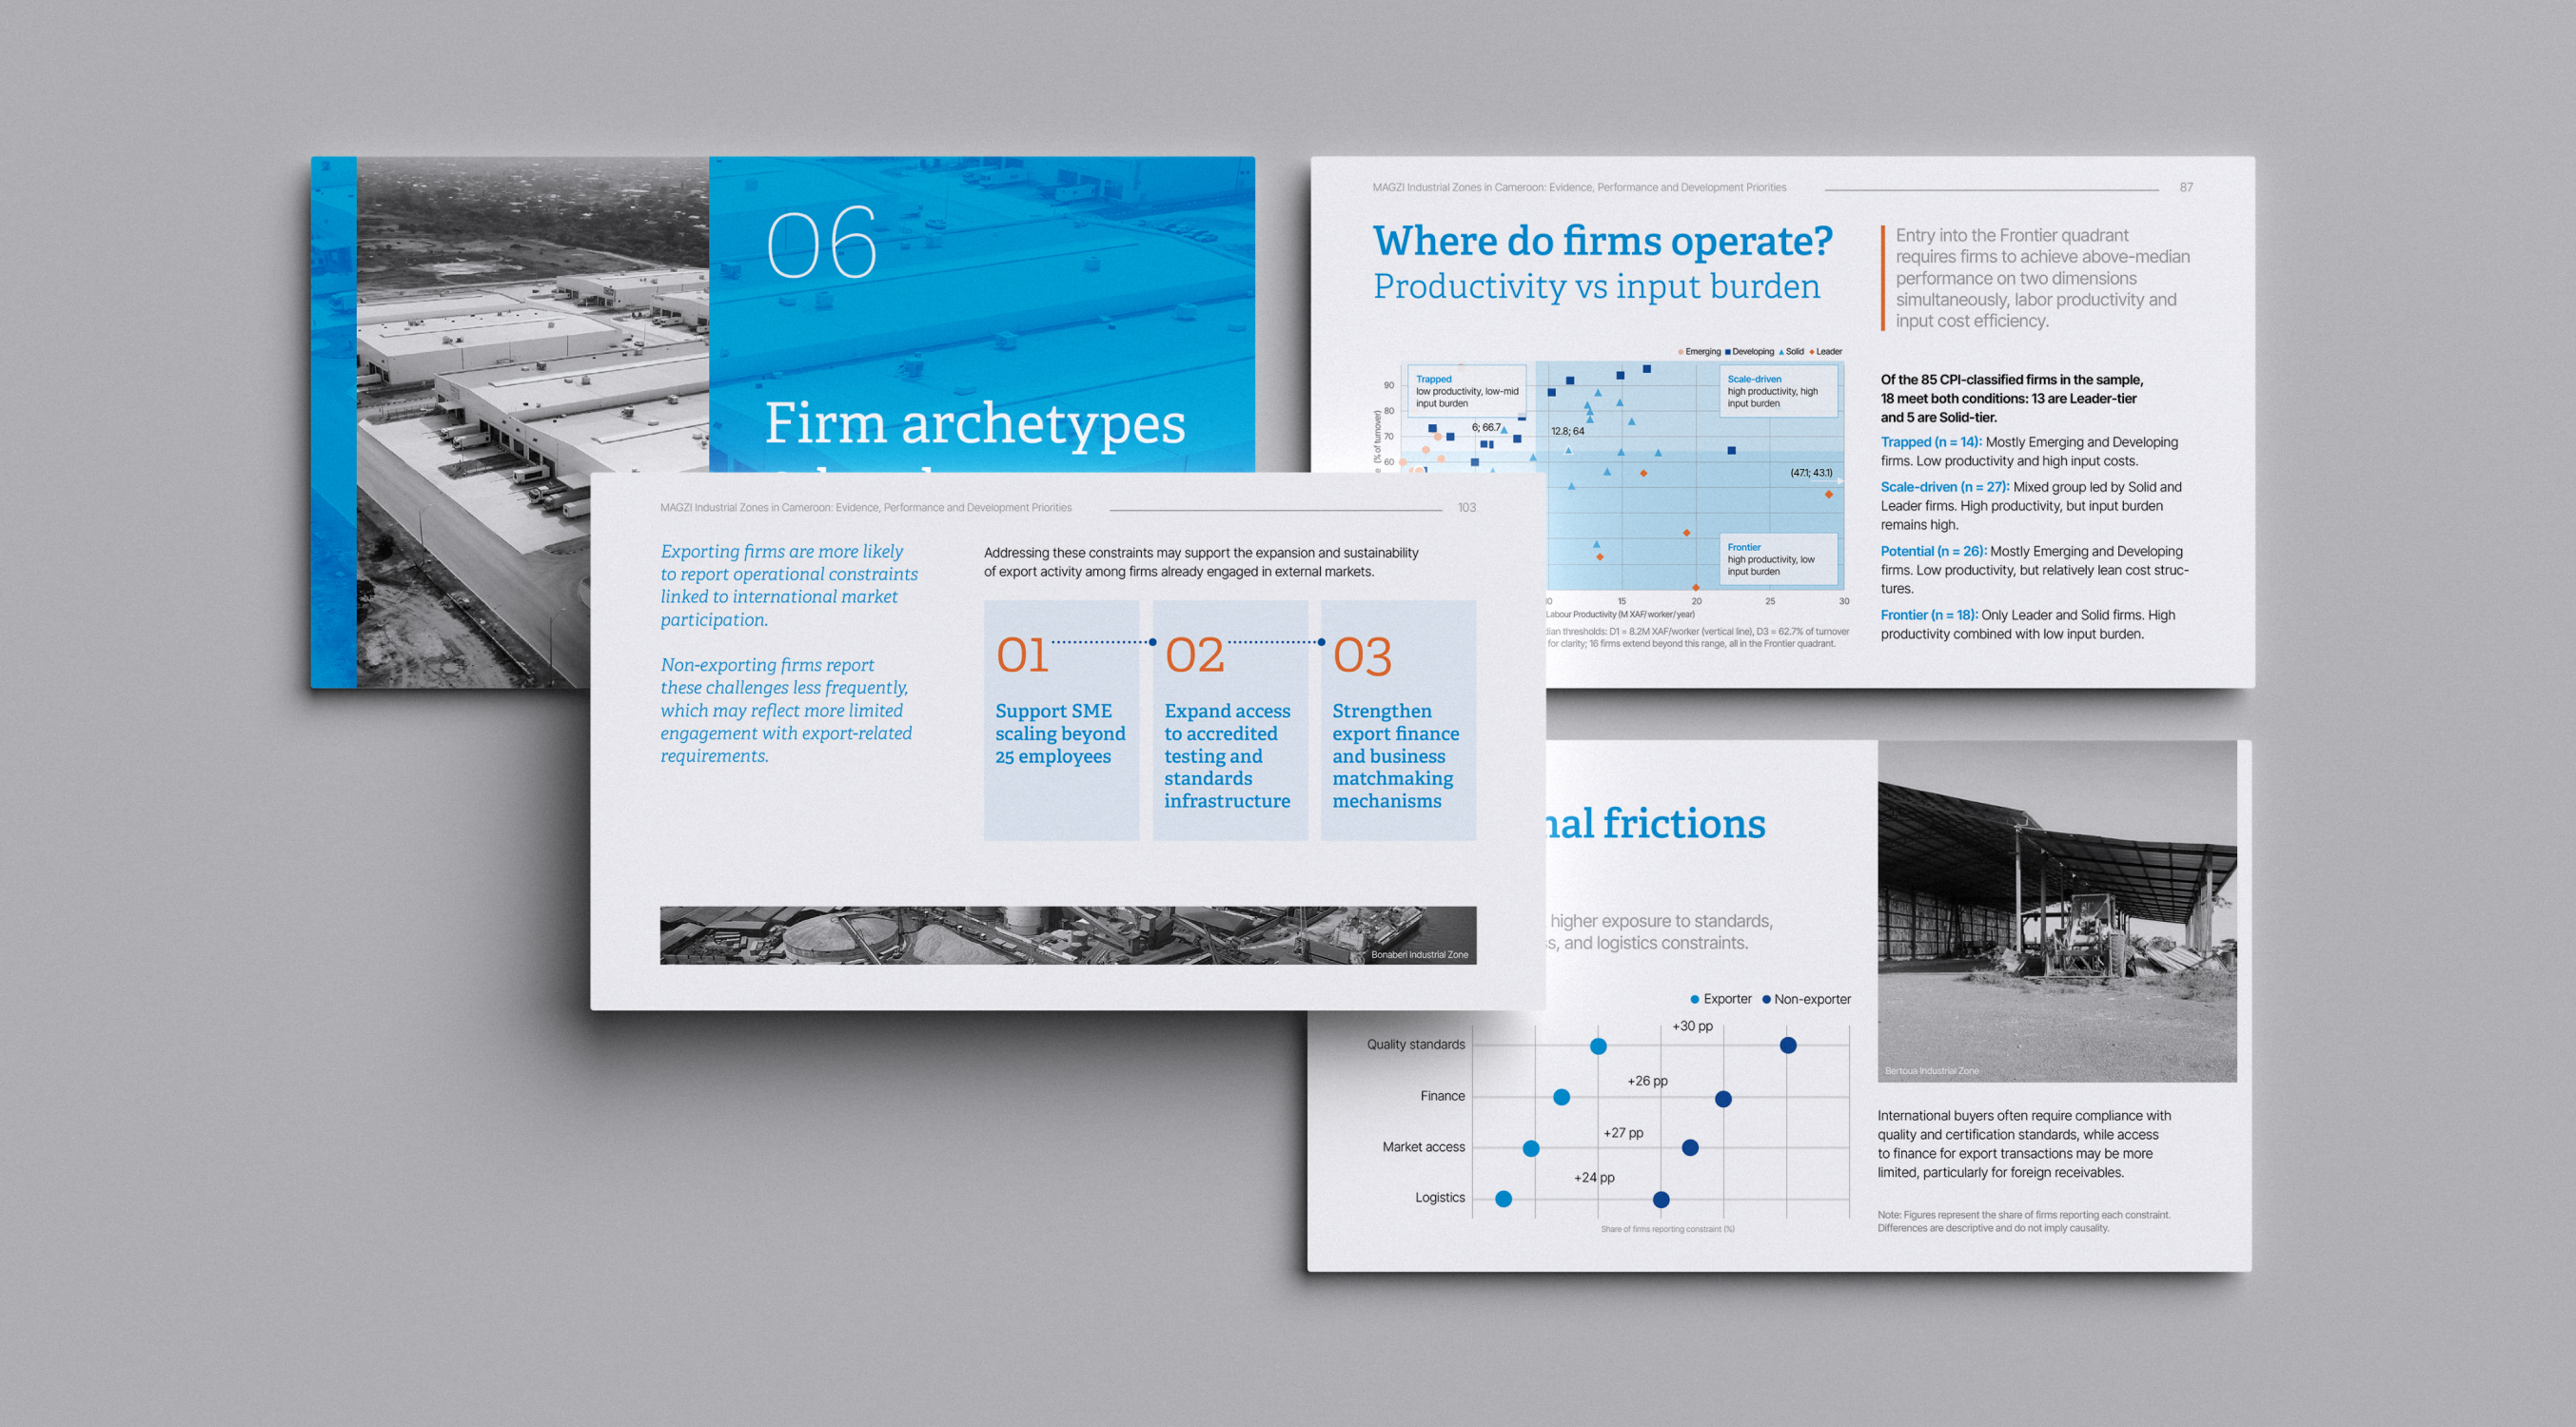
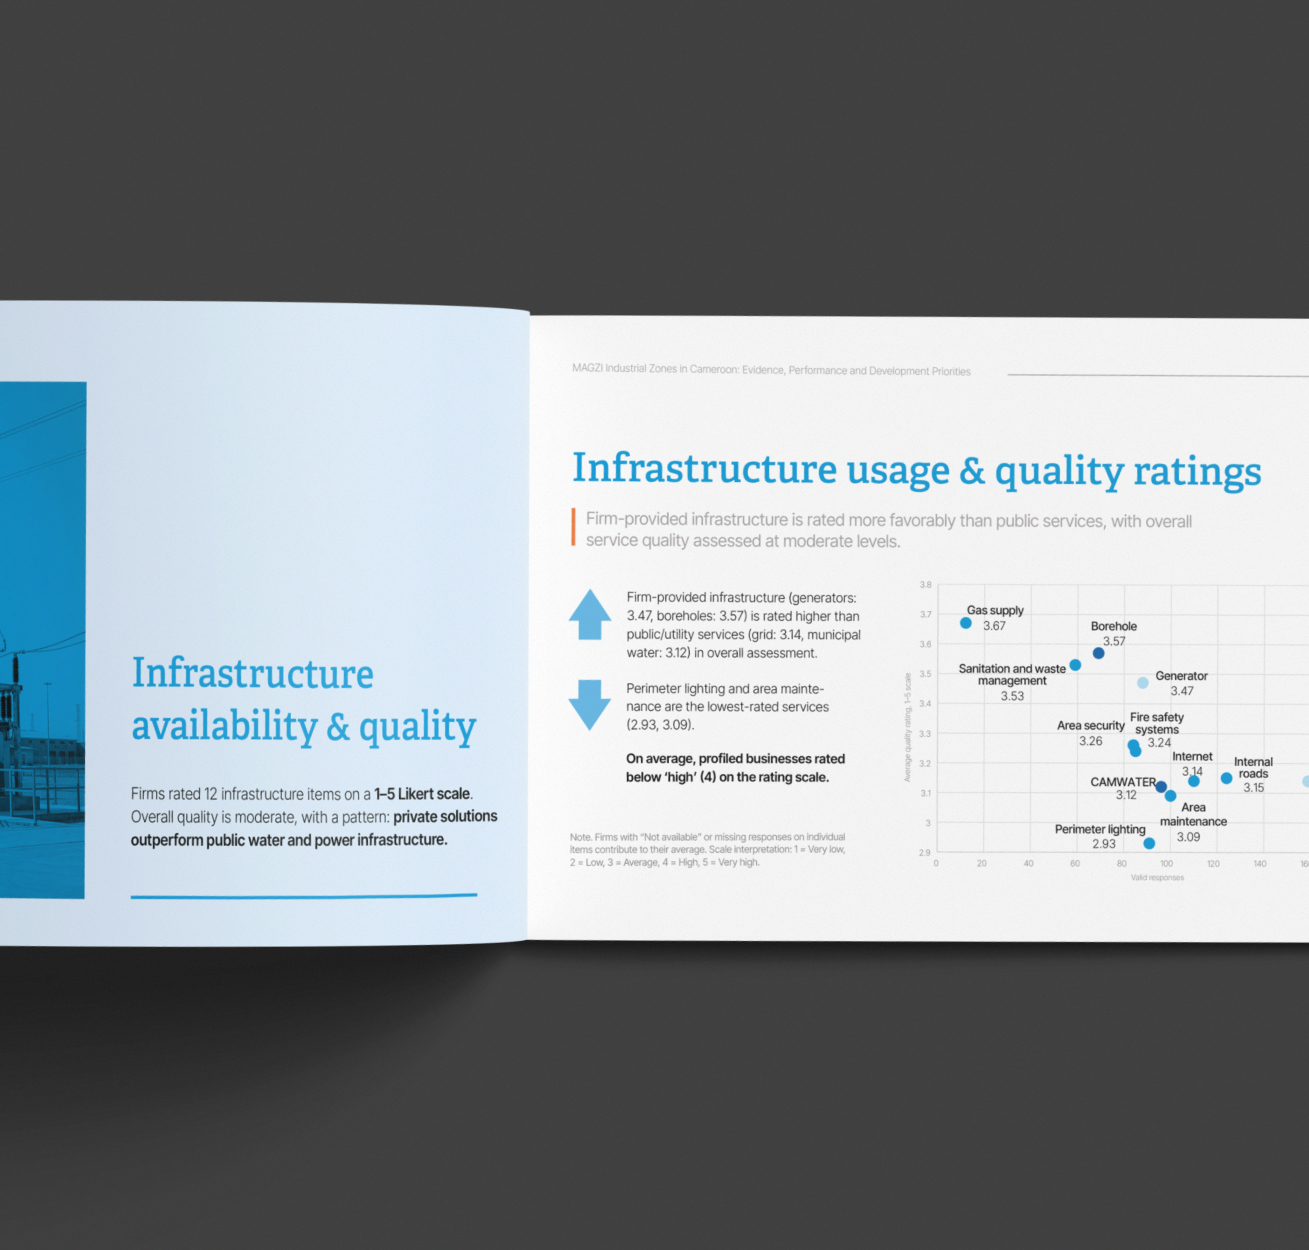
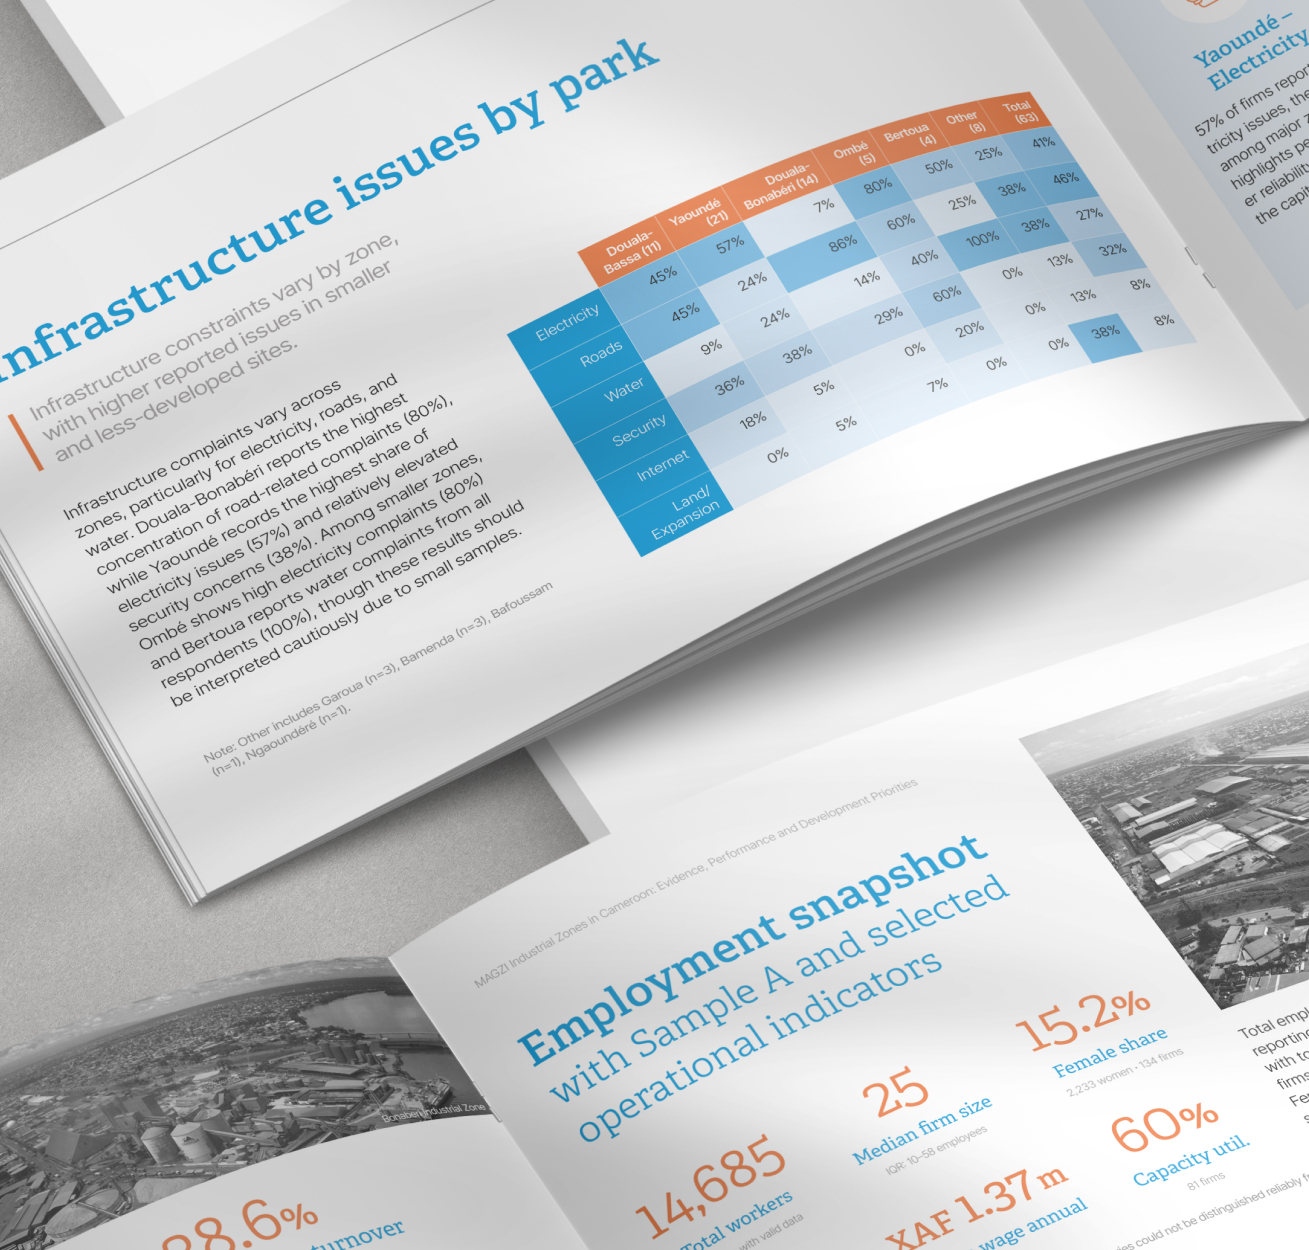
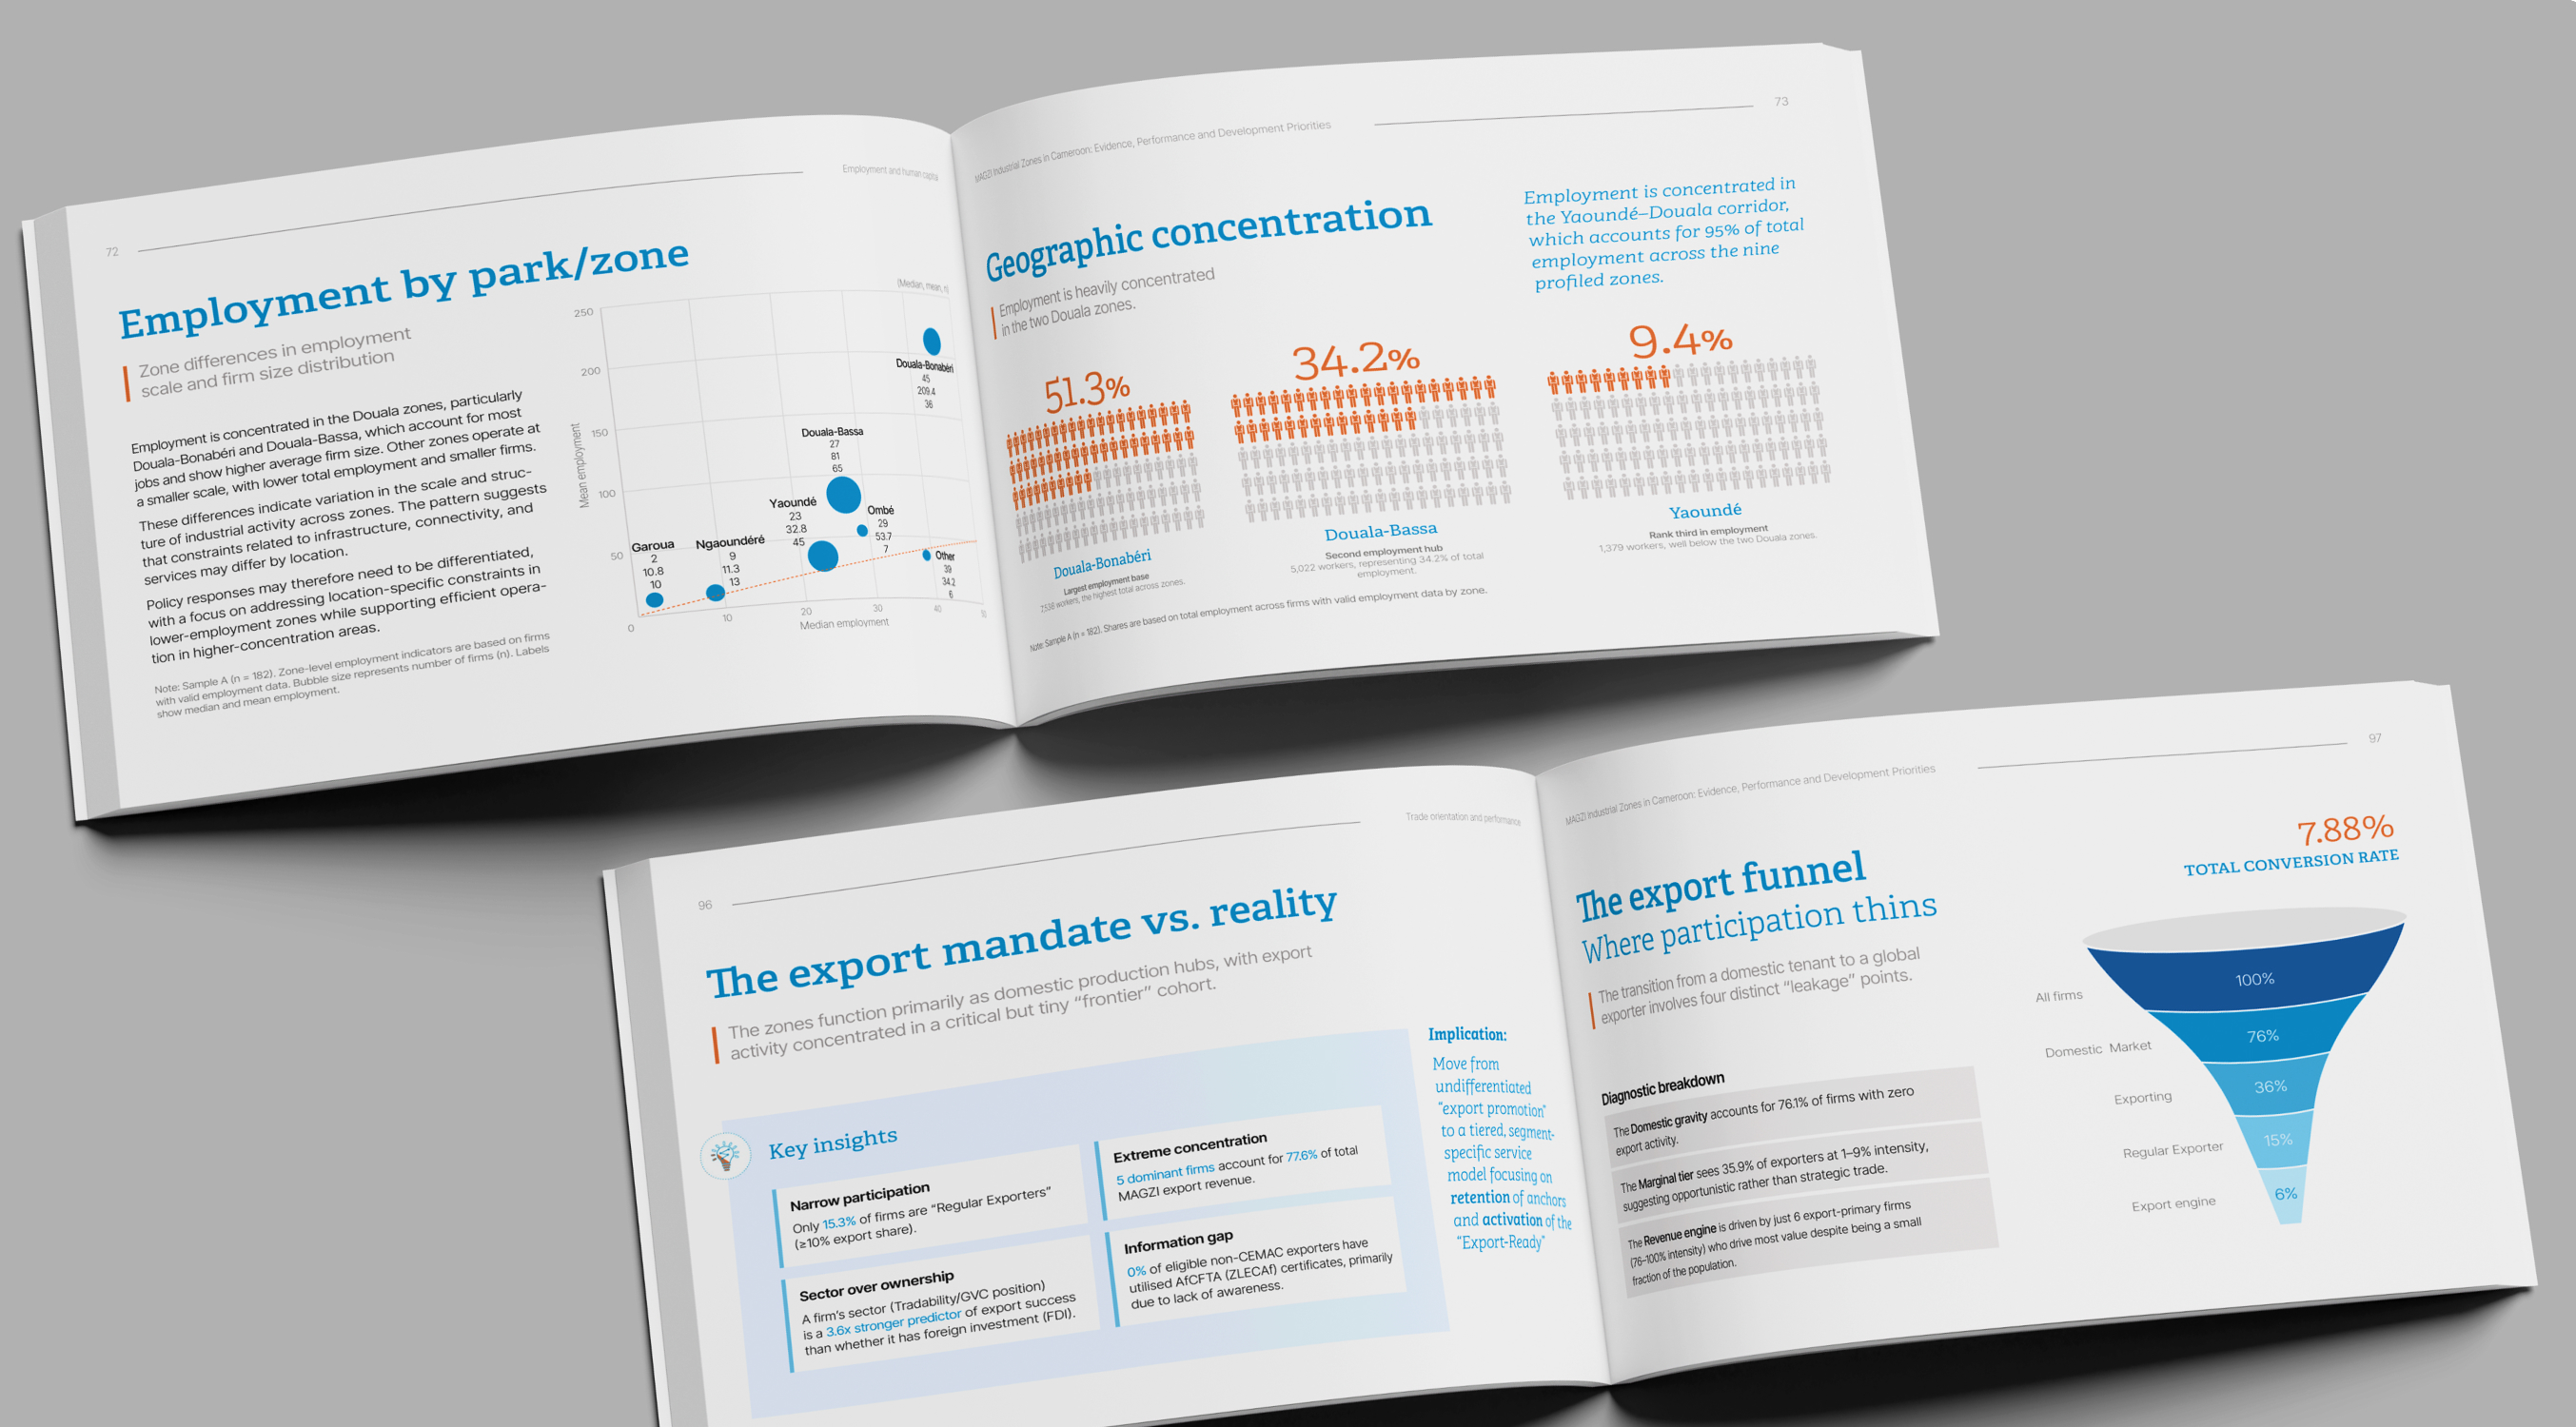
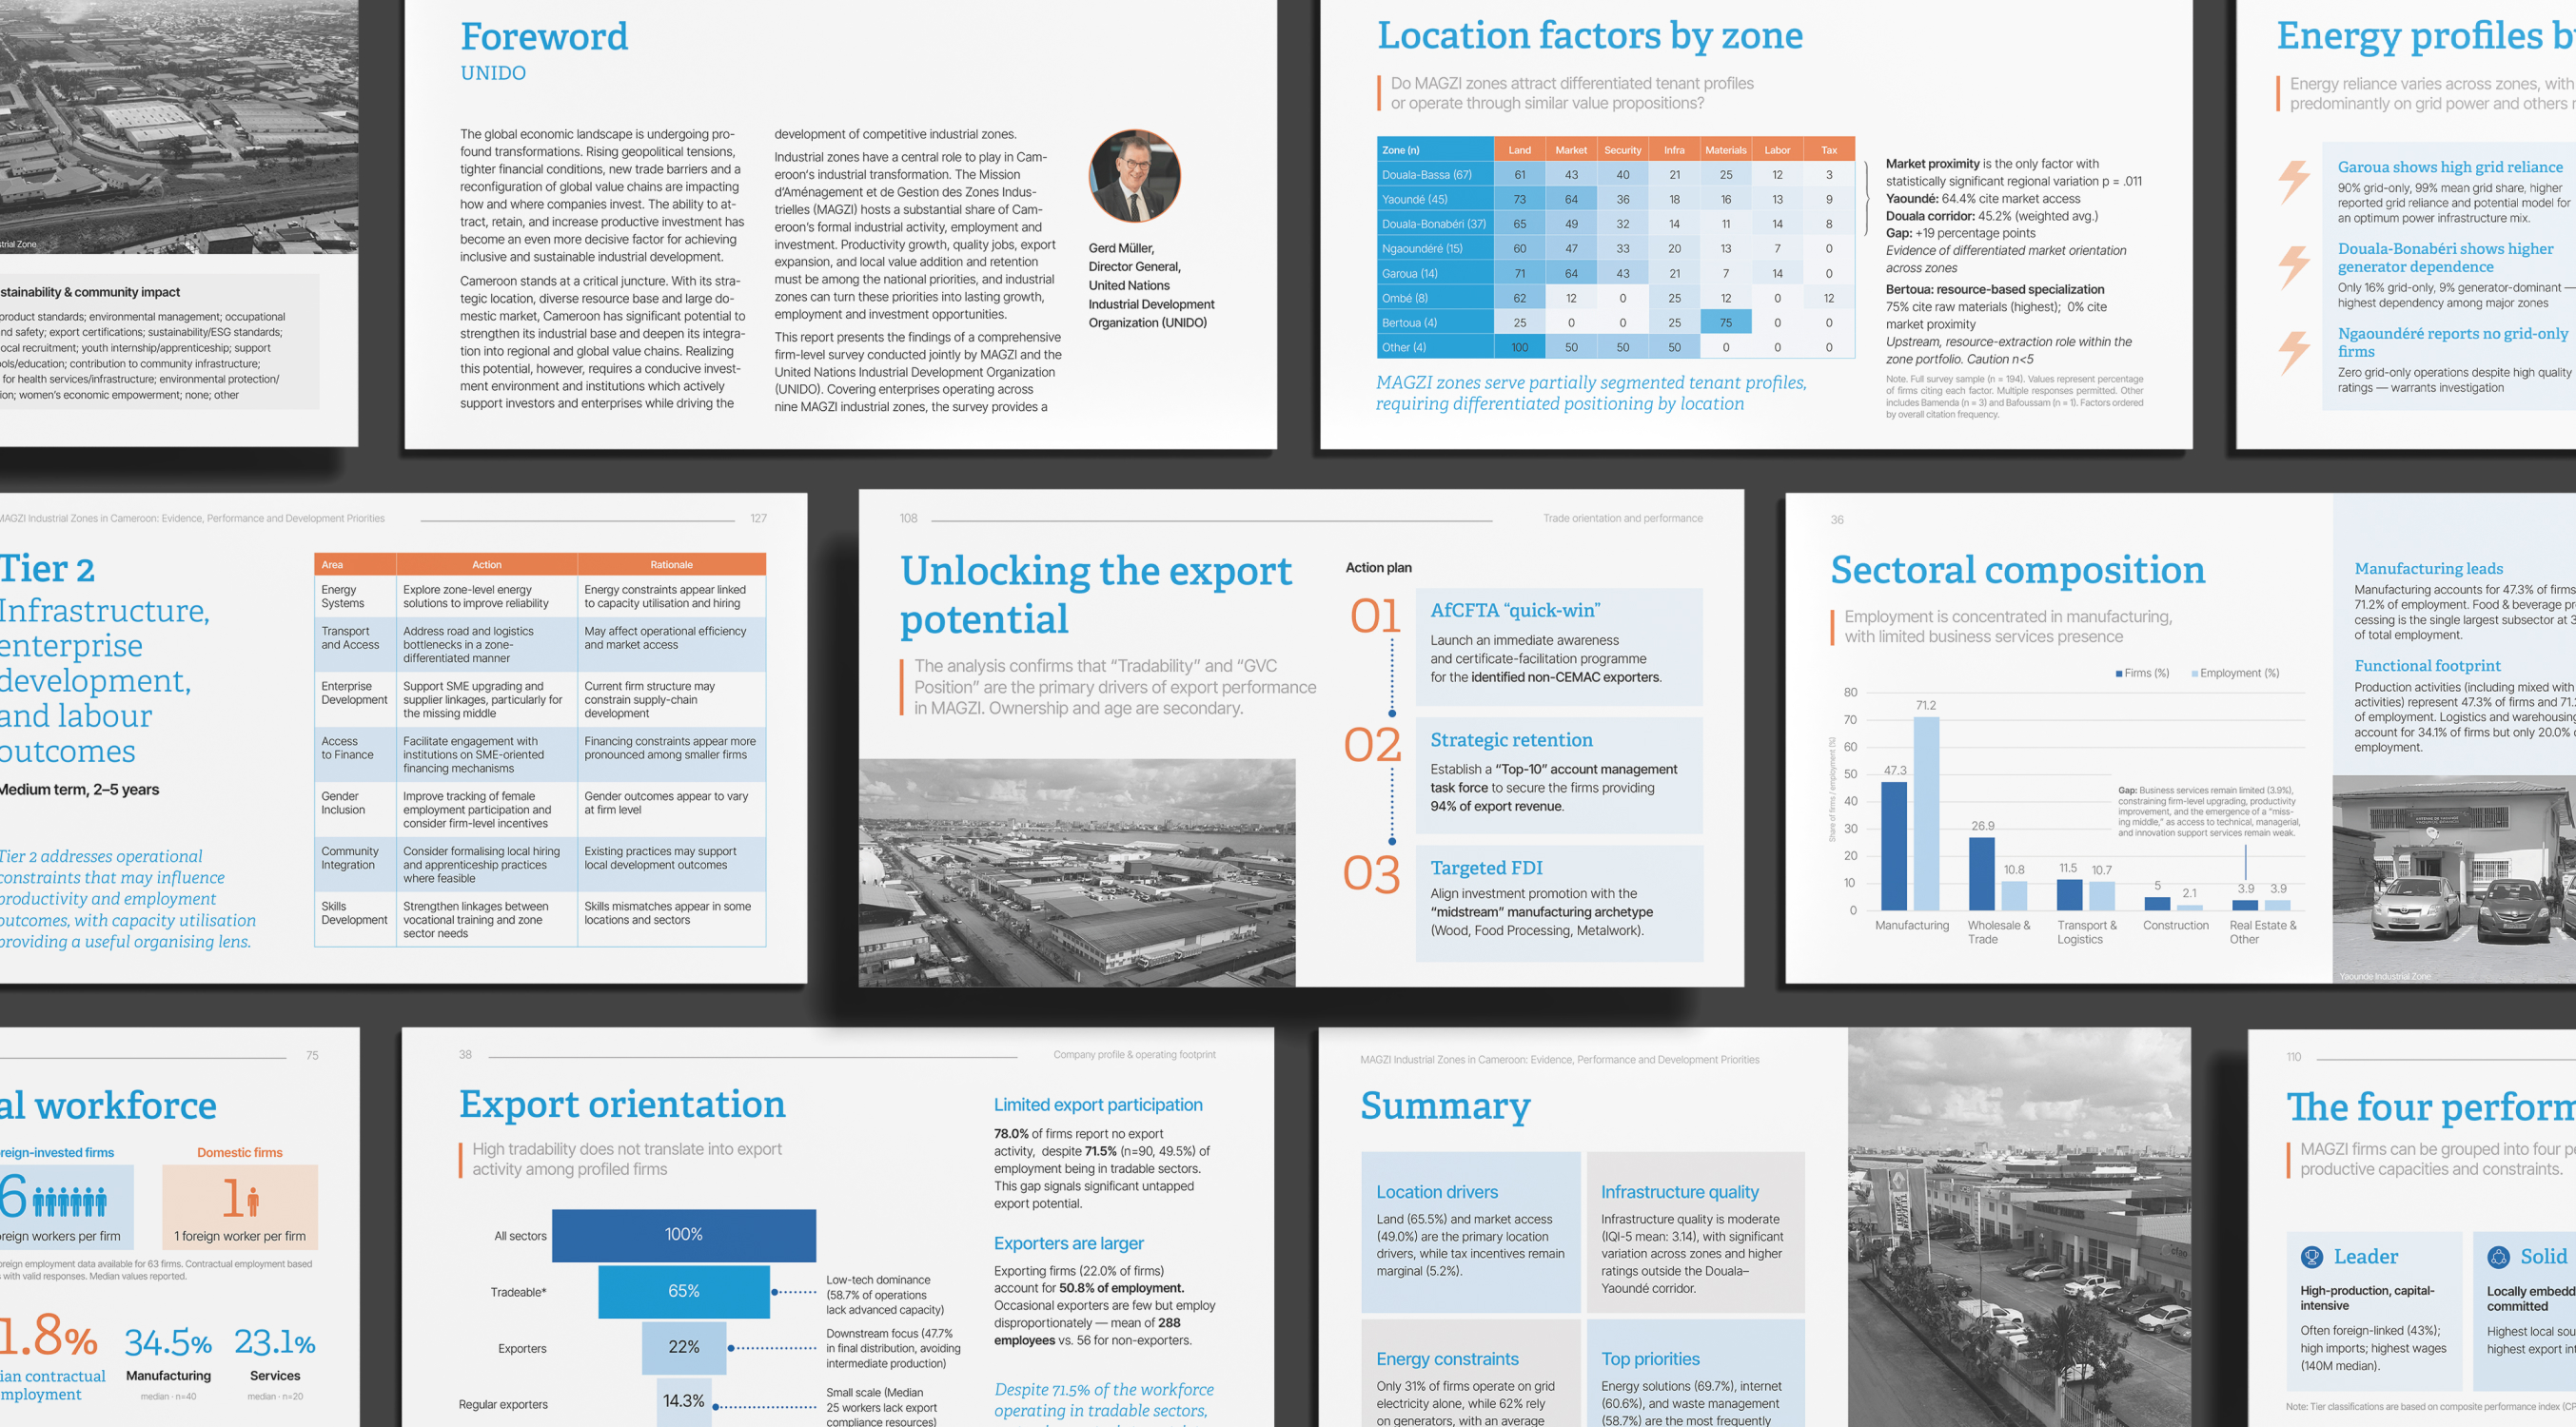
Open brochure spread showing a page titled Company profile & operating footprint with an aerial view of industrial buildings on the left page and an introduction and analytical framework on the right with key data: 182 unique firms analyzed, 14,685 total employees represented, and 9 MAGZI industrial zones covered.Open booklet showing a report page titled 'Female workforce' with data about female employment. It highlights that female share is 15.2%, illustrated by 15 blue female icons among grey icons. Sections describe distribution across firms with female employment typically in the 10-13% range, and a demographic baseline stating female workers represent 15.2% of total employment. Another section on zone patterns notes that 80.6% of female employment is in Douala zones, with pie charts showing female employment share of 28% in Yaoundé and 17% in Douala-Bonabéri.Six pages from a business report featuring sections on legal evolution from public entity to corporate structure with a timeline, employment growth status with statistics and a photo, business environment and location factors with aerial industrial zone photo, location pull factors with a bar chart, ownership structure and legal form with a bubble chart and employment shares, and firm maturity and life-cycle phase with a 5-step timeline diagram and employment data.Open booklet showing business report pages with sections on introduction and analytical framework, operational status with pie charts, a black-and-white photo of a road, energy source portfolio with percentages and icons, and energy dependency profiles with colored arrow graphics and percentages.A layout of four slides from a business presentation titled 'Firm archetypes,' featuring a blue header and black-and-white images of industrial zones, charts comparing productivity versus input burden for firms, and bullet points recommending support for SME scaling, accredited testing access, and export finance strengthening.Two-page spread from a report titled 'Infrastructure availability & quality' and 'Infrastructure usage & quality ratings' showing ratings of firm-provided infrastructure versus public services on a 1-5 Likert scale. A graph displays average quality rating by service, with gas supply, borehole, sanitation, waste management, and generators rated higher than perimeter lighting and area maintenance, which are lowest. It notes private infrastructure solutions outperform public water and power and that profiled businesses rated below 'high' on average.Open booklet showing a report page titled 'Infrastructure issues by park' with a colored table comparing electricity, roads, water, security, internet, and land expansion issues across six zones, alongside a summary paragraph and notes; another visible page titled 'Employment snapshot' displays key workforce statistics and operational indicators along with a black-and-white aerial photo of an industrial zone.Open report showing two double-page spreads with graphs and text on employment and exports in Cameroon zones. The top spread includes a scatter plot and infographic highlighting geographic concentration of employment in Douala-Bonabéri, Douala-Bassa, and Yaoundé zones. The bottom spread covers export mandate versus reality, key insights on narrow participation, sector ownership, extreme concentration, and information gap, plus a funnel chart of export participation showing a 7.88% total conversion rate through stages from all firms to export engine.Collage of slides from a report on MAGZI industrial zones in Cameroon, featuring topics like foreword by Gerd Müller from UNIDO, location factors by zone, energy profiles, tier 2 infrastructure and enterprise development, unlocking export potential with an action plan, sectoral composition with employment chart, export orientation with participation statistics, summary of location drivers and infrastructure quality, and workforce overview with foreign and domestic worker data.

More cases in this category

Go to the category
Person with long dreadlocks wearing a red beanie and black shirt, smiling up at the camera while holding a tablet and stylus, surrounded by black and white letter cutouts on a light surface.

Need help designing a report? I can help you create reports of any complexity and develop all accompanying design materials.

Follow me on
Linkedin