Reports and Publications

Monitoring Report Data Visualization

Science at Risk Emergency Office, Germany
Cover and open pages of the report titled 'Academia in Ukraine: Navigating the Protracted War' by Science at Risk, November 2025. The cover features a geometric network pattern with yellow lines on a dark background. Inside pages show text with a bar chart of respondents' scientific fields and a color-coded map of Ukraine illustrating regional distribution of survey respondents by displacement and relocation of higher education institutions.

Challenge

Creating a design solution to turn complex tabular research data into clear and engaging visualizations.

Services

  • Report design
  • Data Visualization
  • Print-ready and web versions
  • Design for presenting research findings
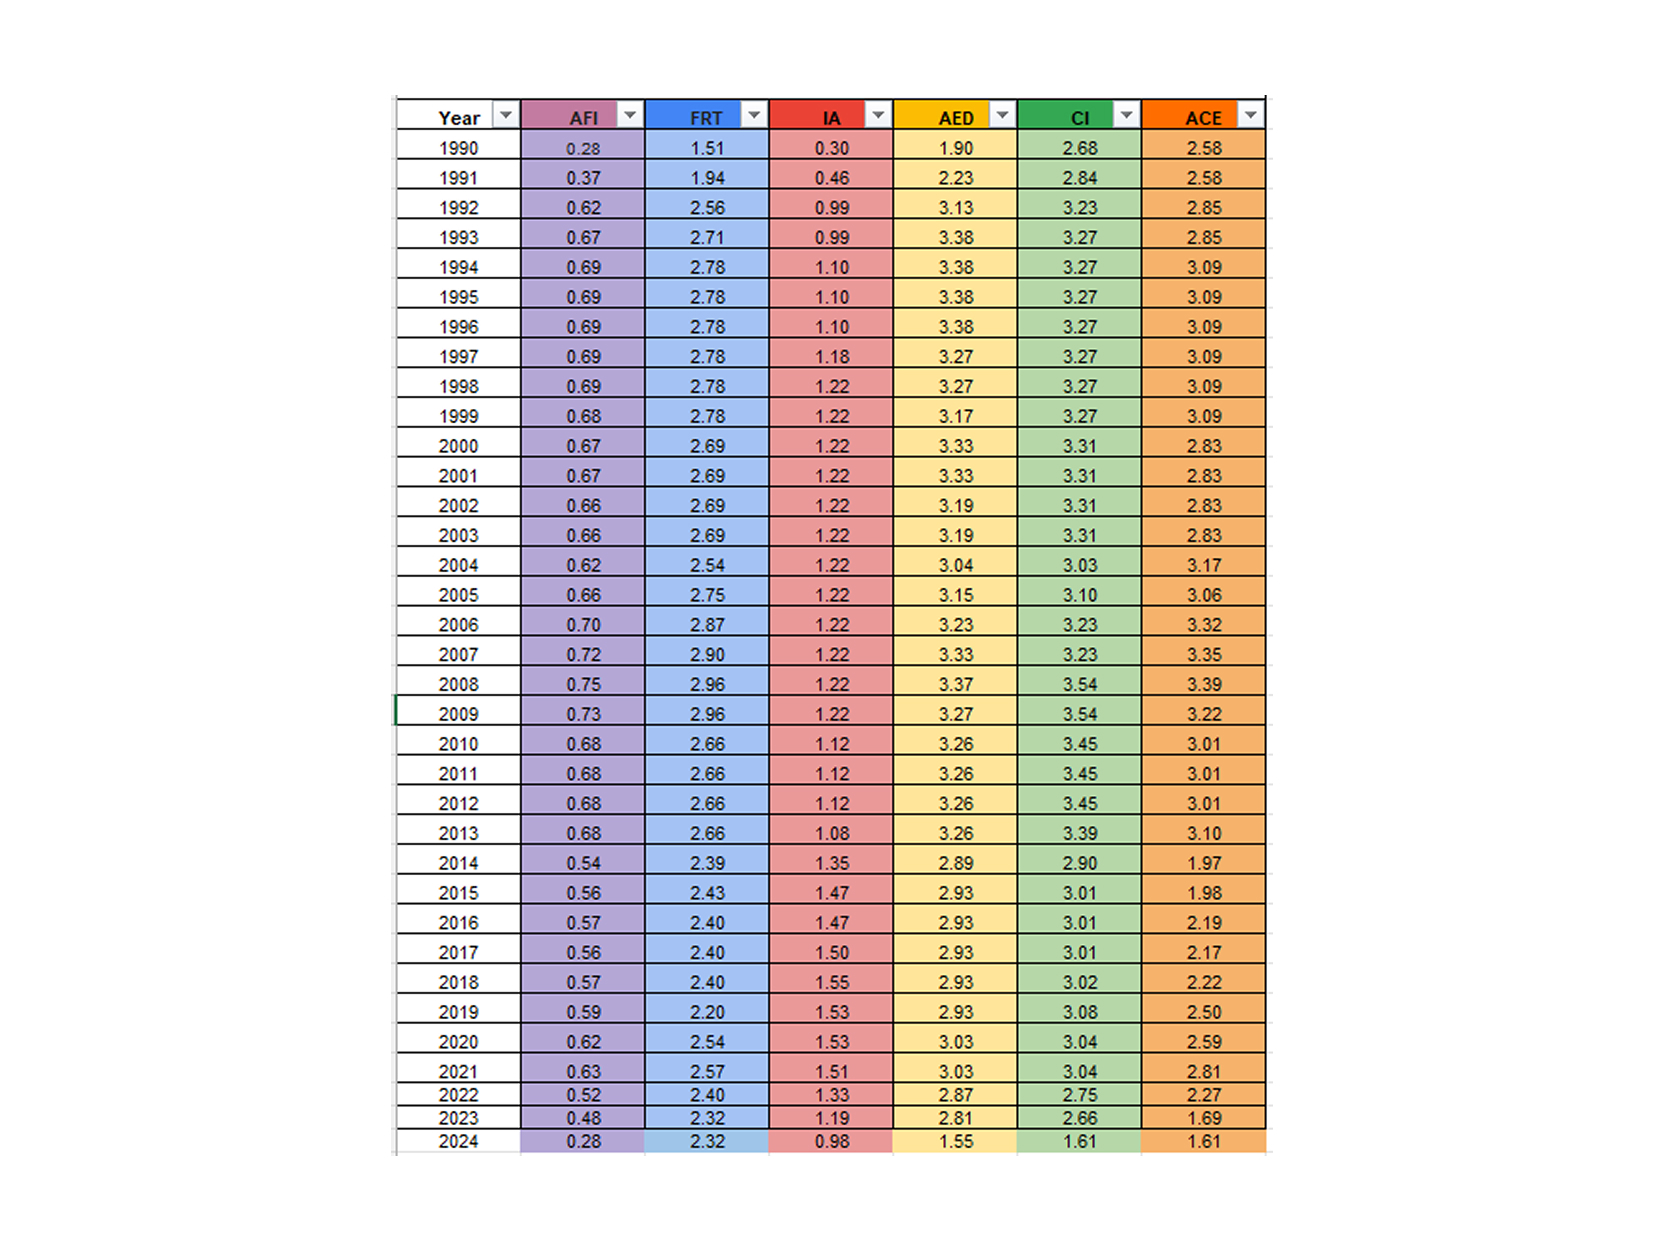
Open book spread showing text with sections discussing challenges in Ukrainian academia amid the war, including financial aid, research funding, and institutional support, alongside an introduction to a 2025 Science at Risk Monitoring Report. The right page features a photo of a damaged six-story building with balconies and trees in front, under a clear blue sky.Table of yearly data from 1990 to 2024 with columns labeled Year, AFI, FRT, IA, AED, CI, and ACE, showing numerical values for each year in color-coded columns: purple for AFI, blue for FRT, red for IA, yellow for AED, green for CI, and orange for ACE.
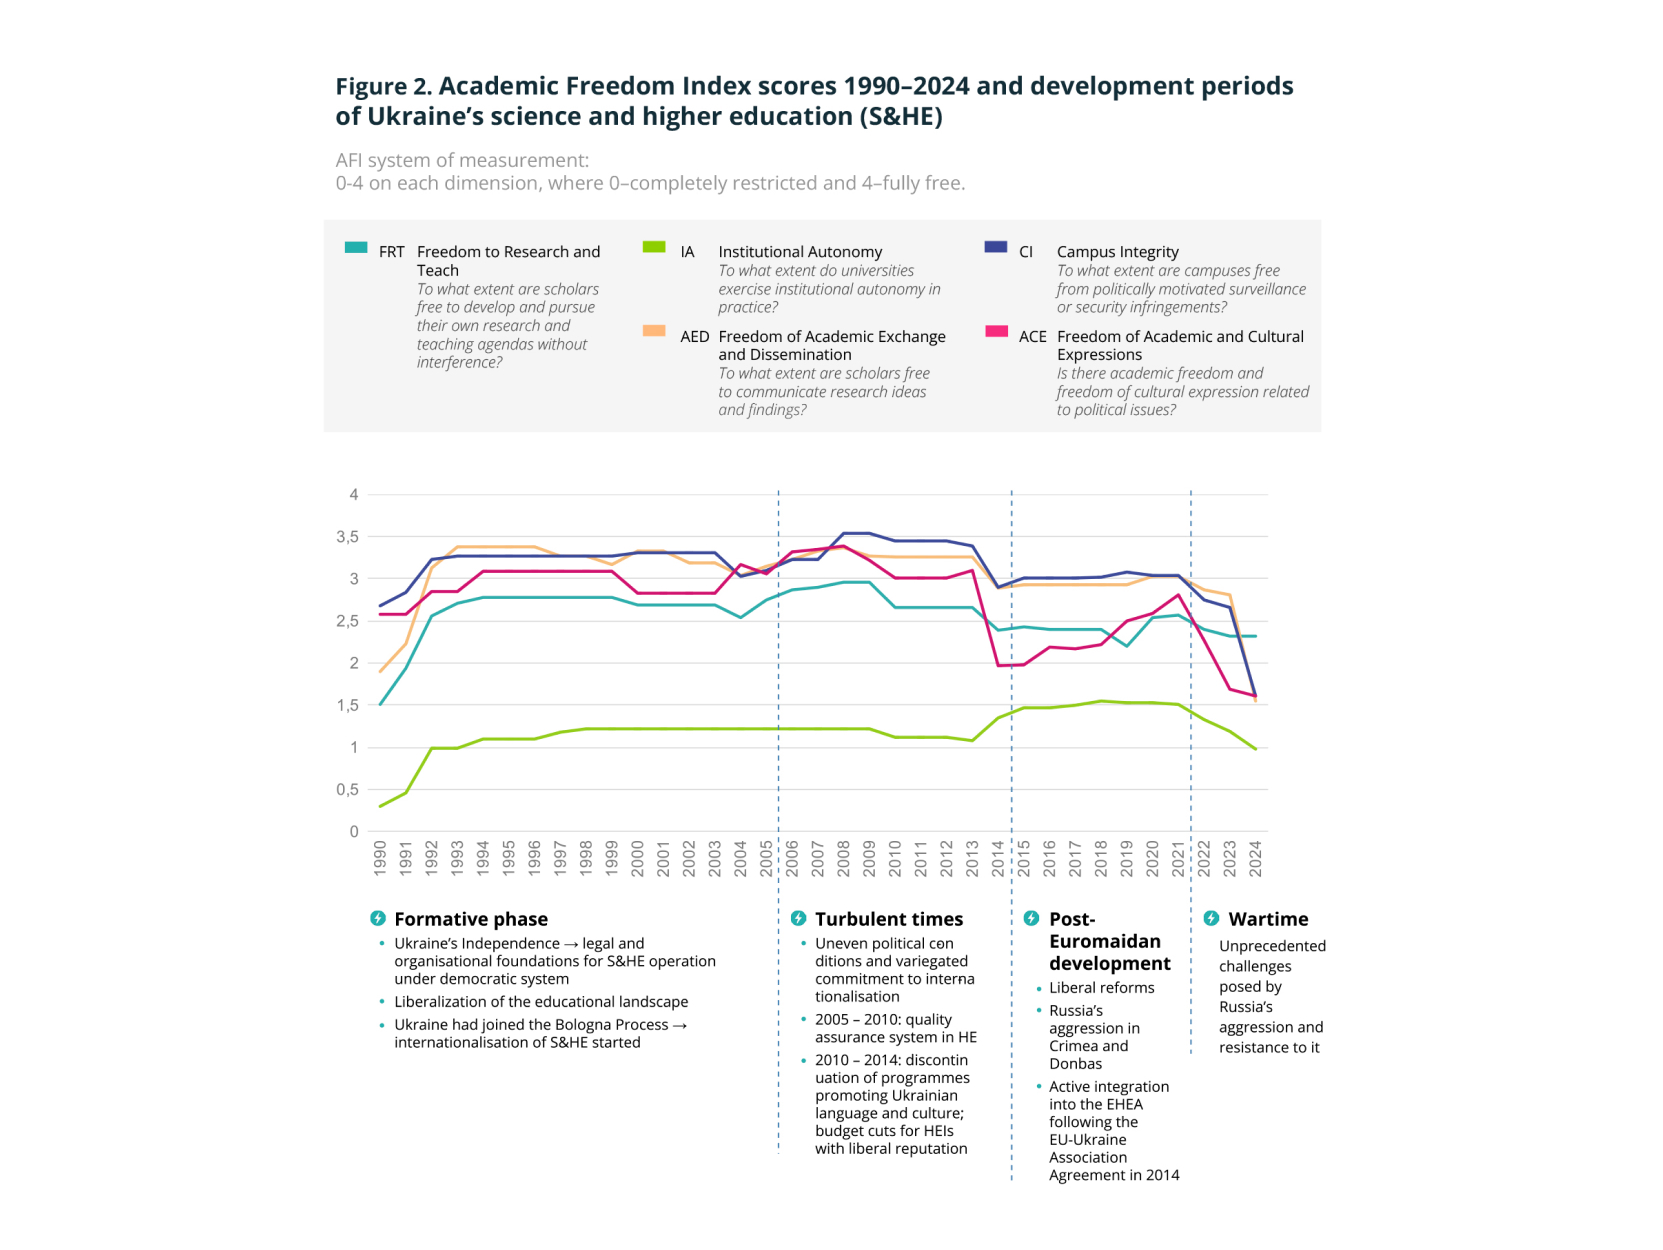
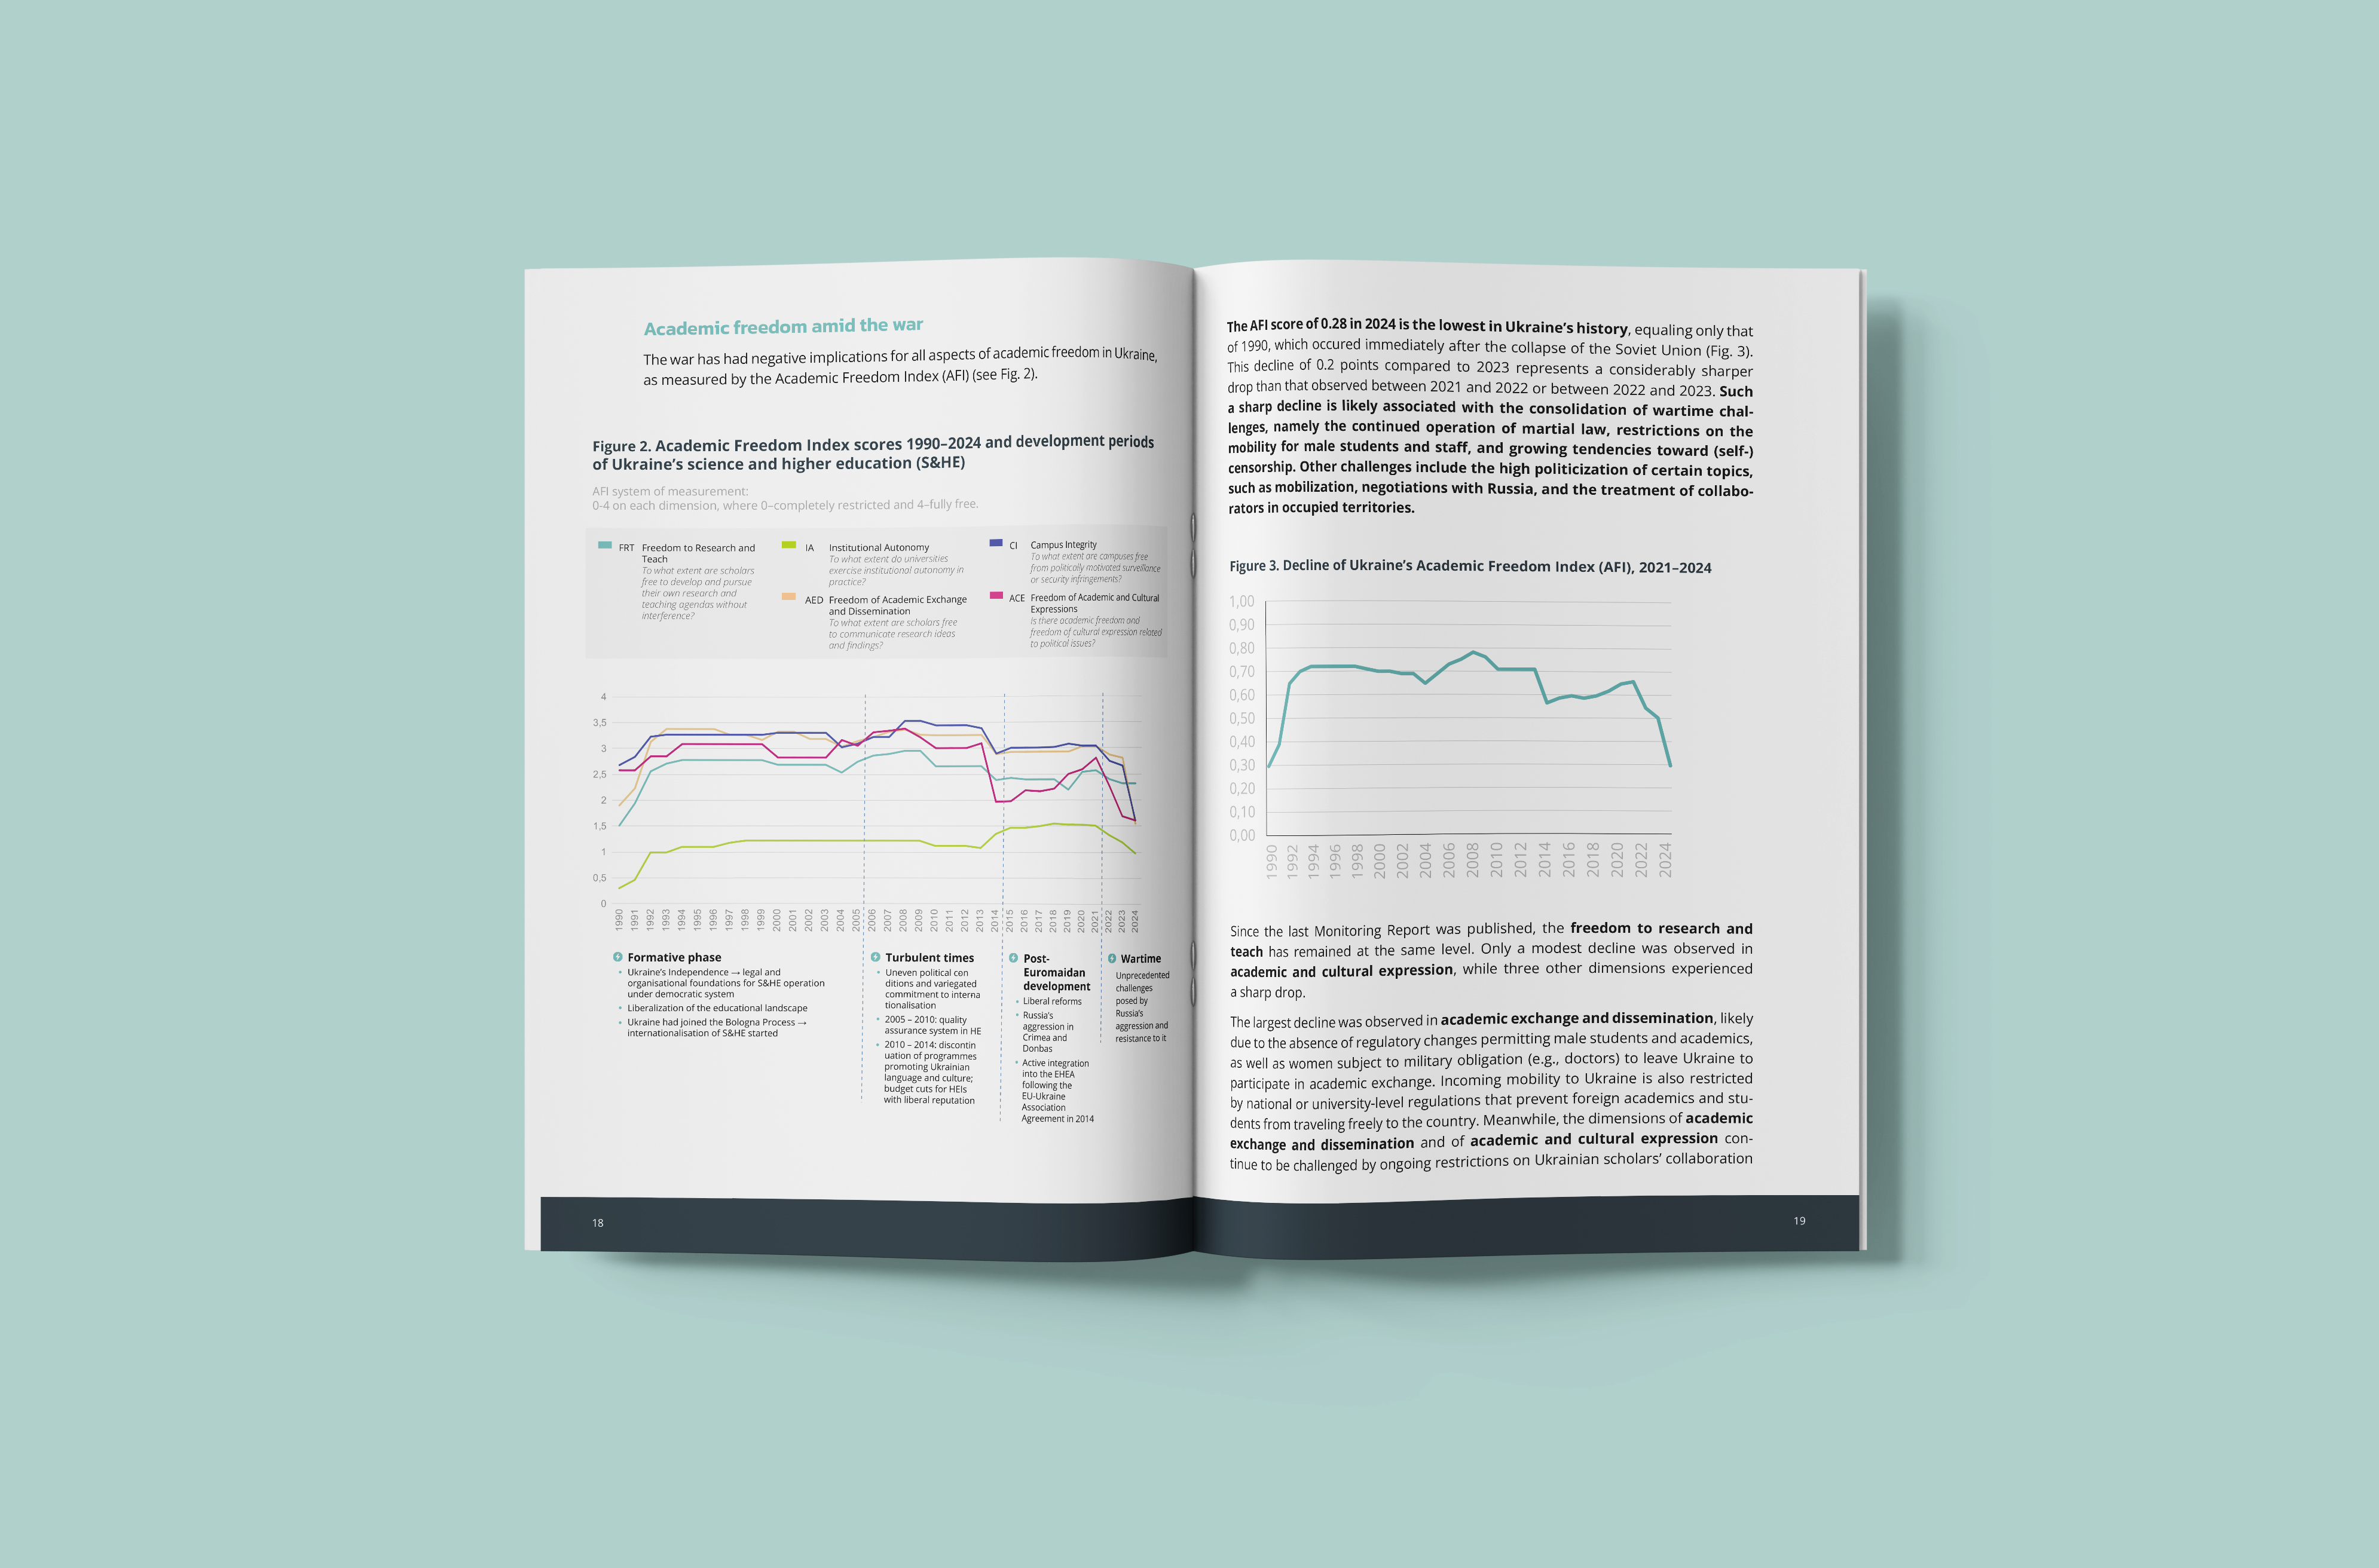
Line graph titled 'Academic Freedom Index scores 1990–2024 and development periods of Ukraine's science and higher education (S&HE)' shows scores from 0 to 4 for five dimensions: Freedom to Research and Teach, Institutional Autonomy, Freedom of Academic Exchange and Dissemination, Campus Integrity, and Freedom of Academic and Cultural Expressions. Scores trend upward from 1990, peak around 2005 to 2013, then decline sharply after 2021. Four development periods are marked below: Formative phase, Turbulent times, Post-Euromaidan development, and Wartime, each with brief descriptions of political and educational context in Ukraine.
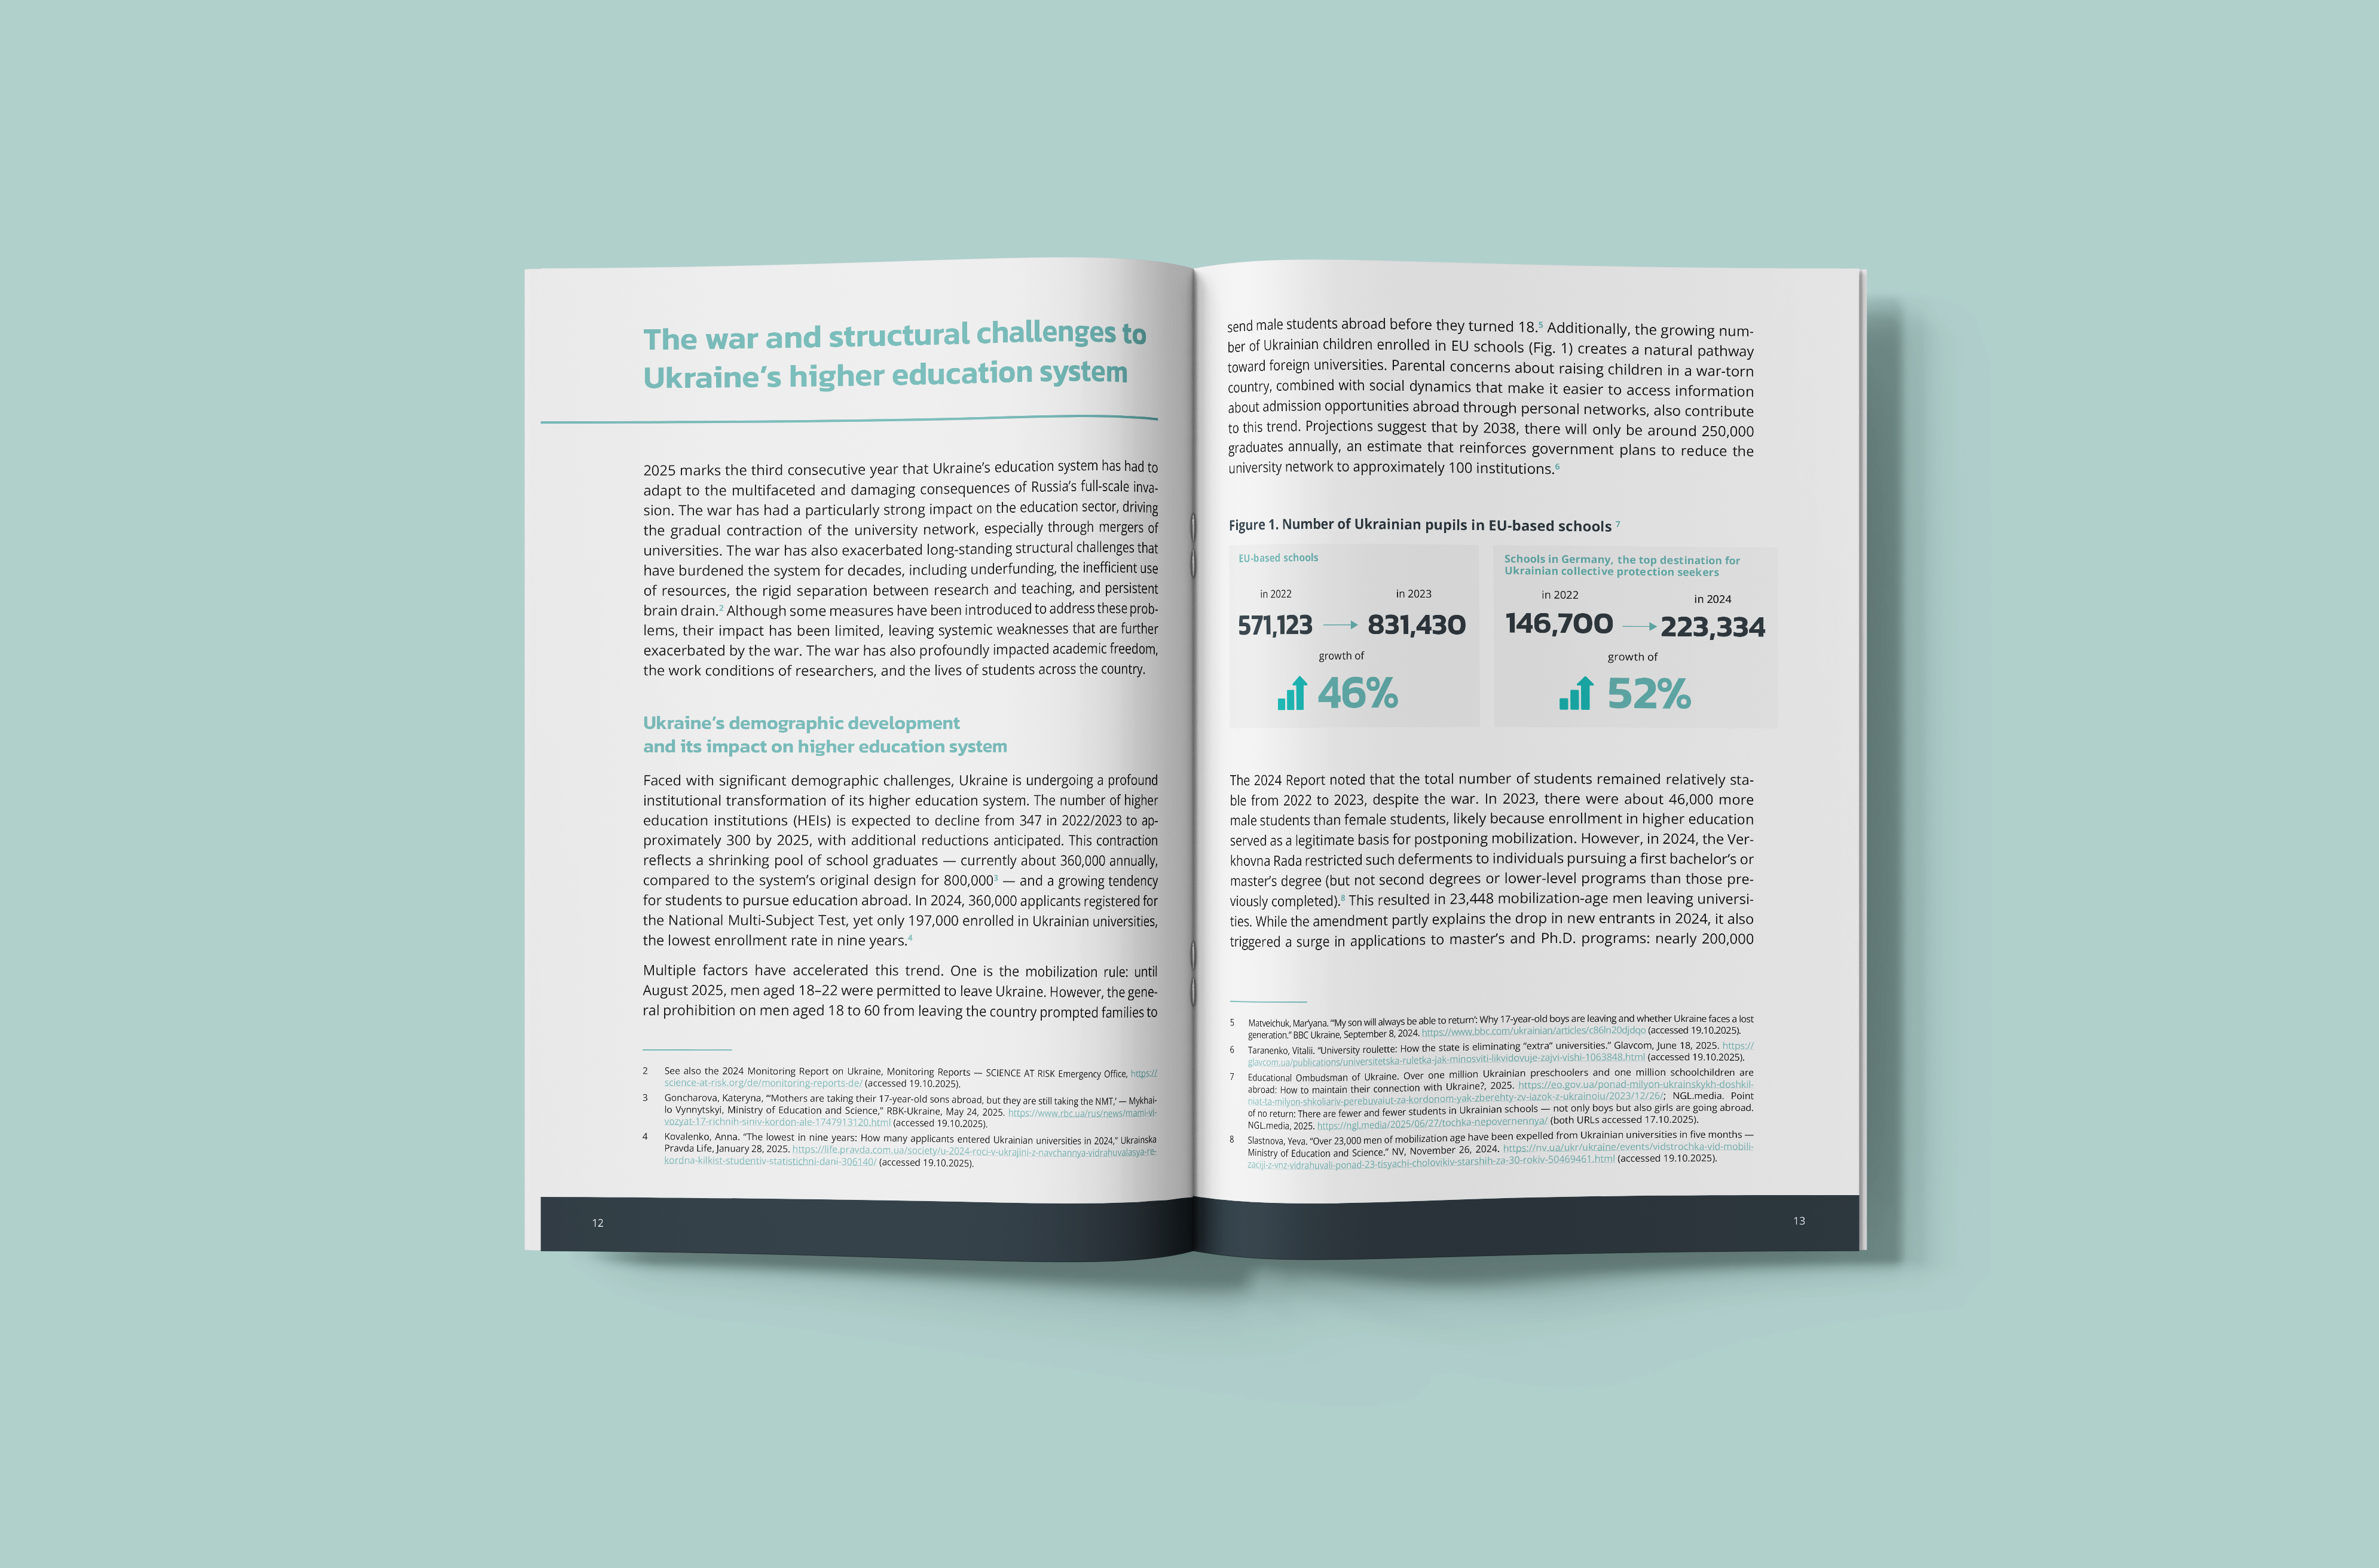
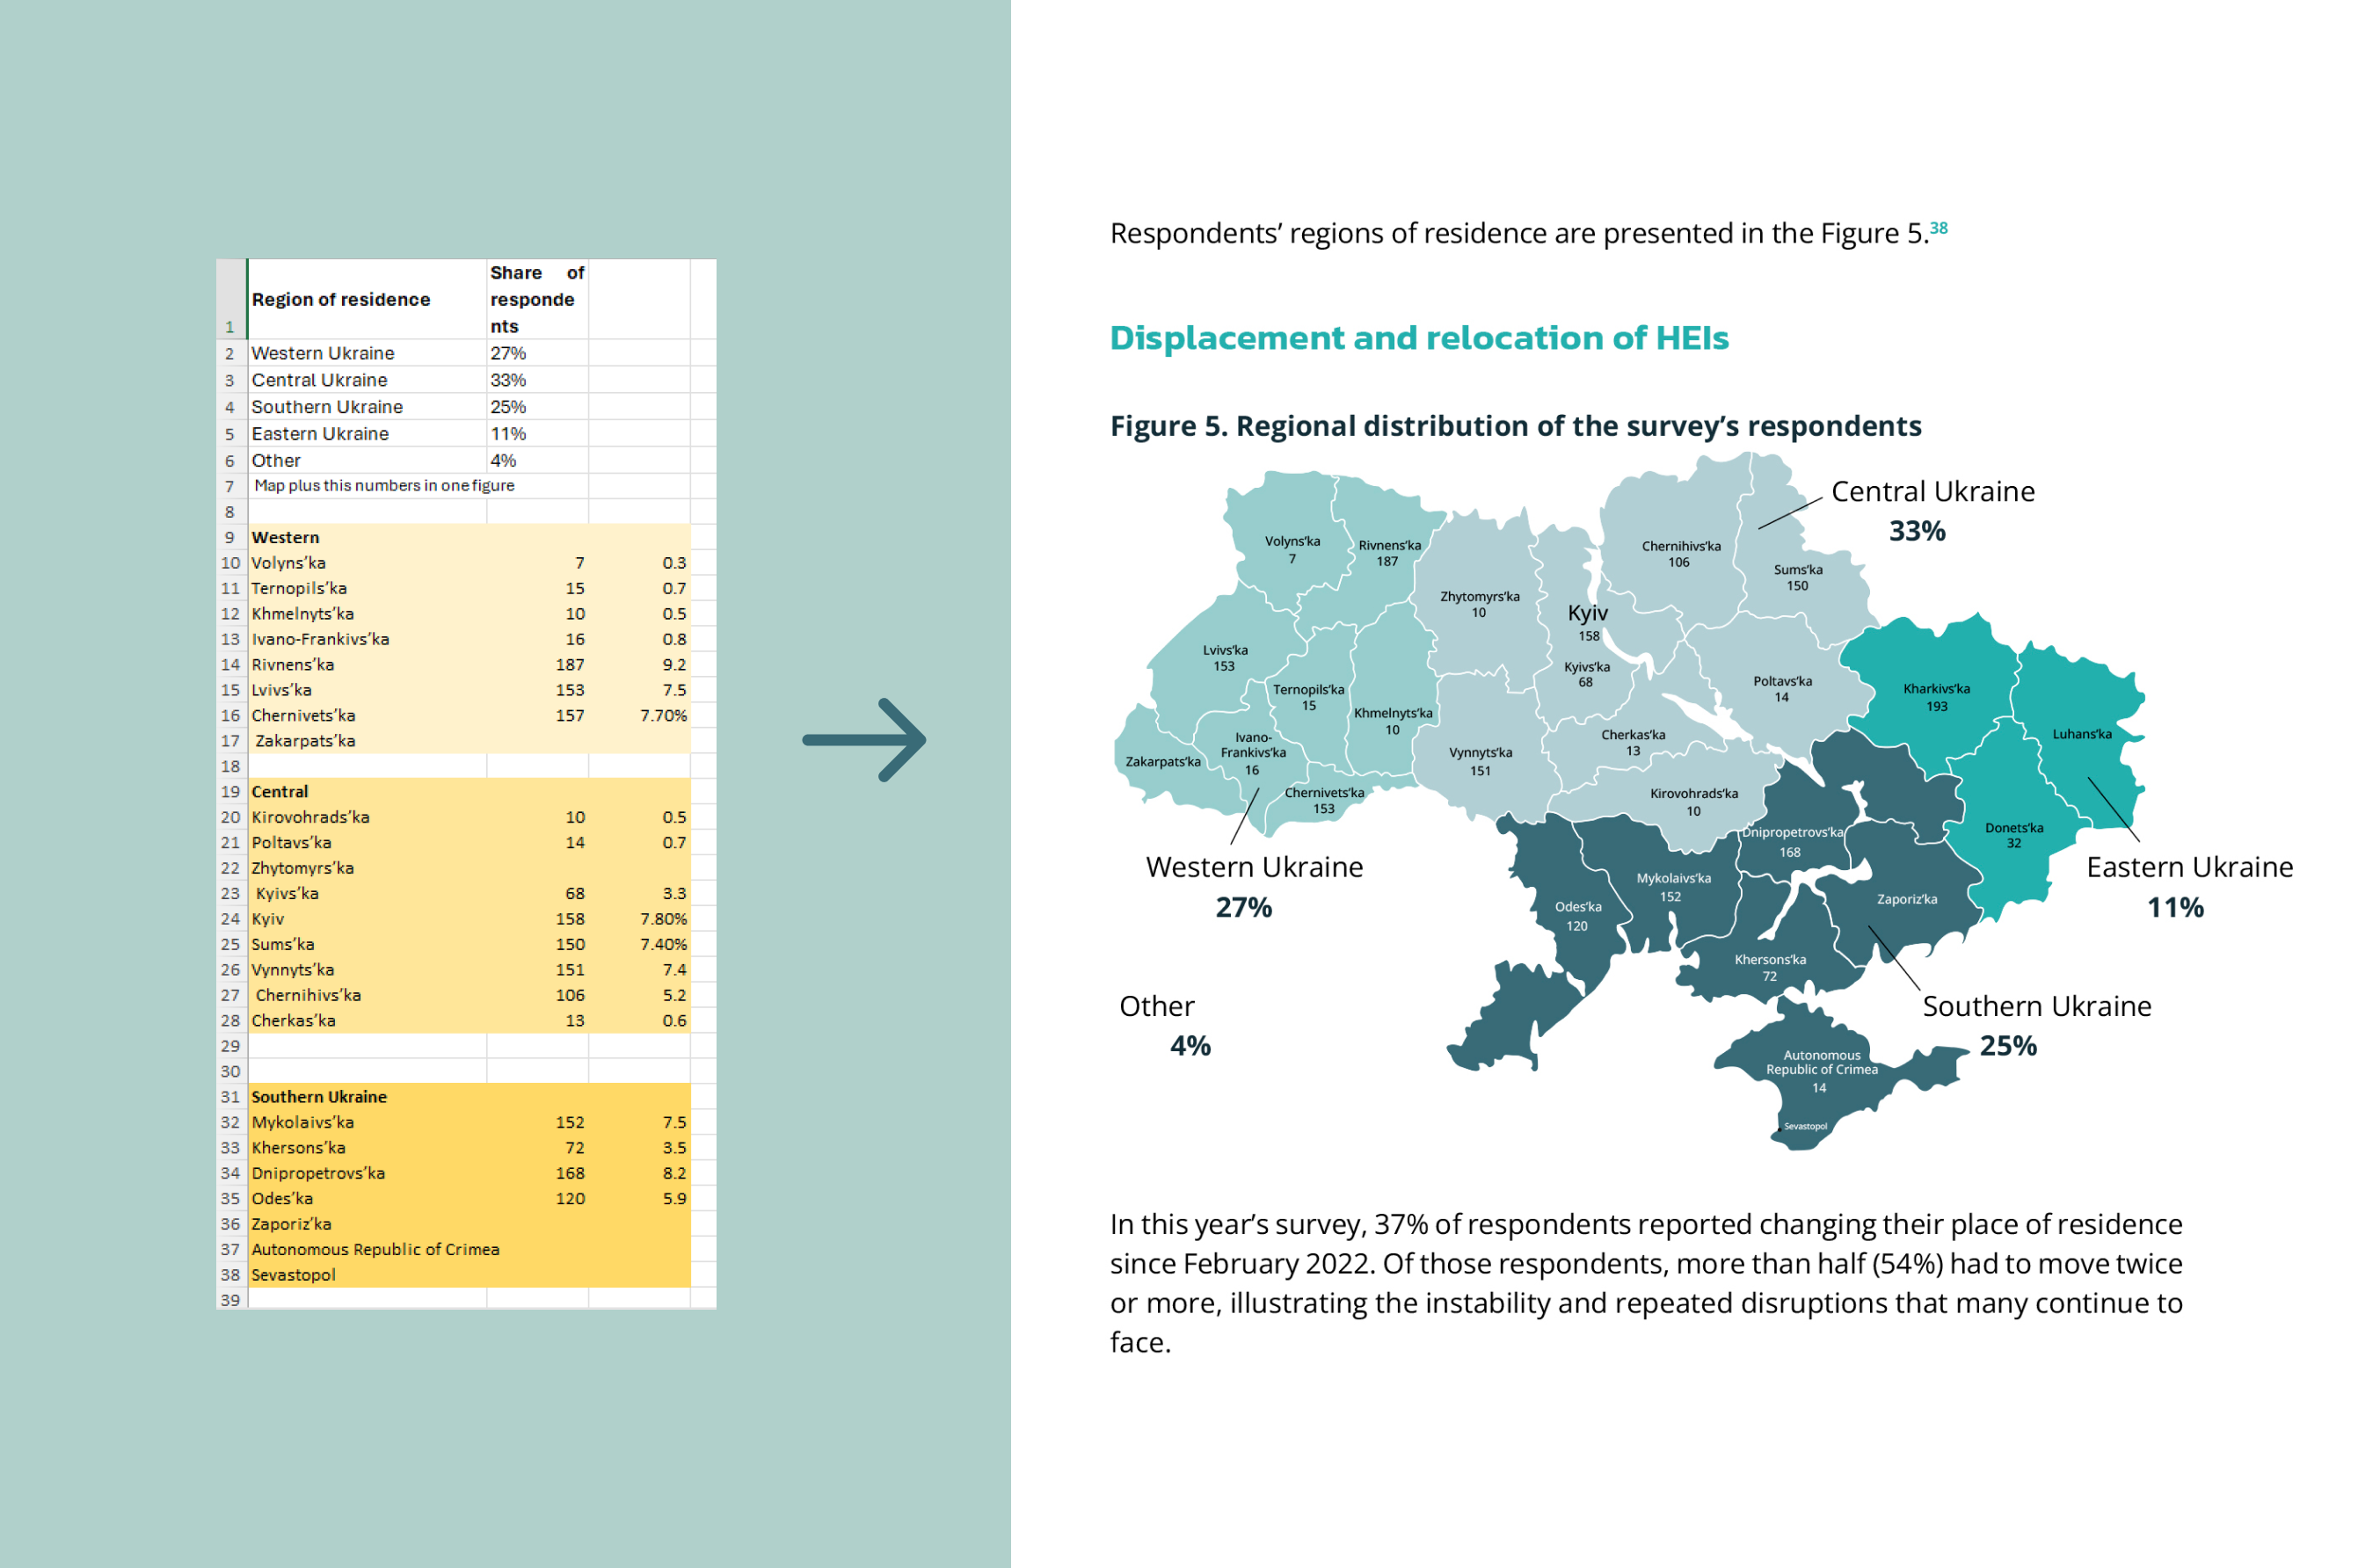
Open book displaying a report titled 'The war and structural challenges to Ukraine’s higher education system' discussing impacts of Russia's invasion on education, demographic developments, academic freedom, and student mobility. Includes a figure showing growth in Ukrainian pupils enrolled in EU-based schools, with numbers rising from 571,123 in 2022 to 831,430 in 2023 (46% growth) and from 146,700 in 2022 to 233,334 in 2024 (52% growth) in German schools as a top destination.A split image showing a spreadsheet on the left with Ukrainian regional data and a map of Ukraine on the right colored by regions representing survey respondents' regional distribution with percentages: Central Ukraine 33%, Western Ukraine 27%, Southern Ukraine 25%, Eastern Ukraine 11%, and Other 4%. The map includes region names and respondent counts. Text explains 37% of respondents moved residence since February 2022, with 54% moving twice or more, indicating instability and repeated disruptions.
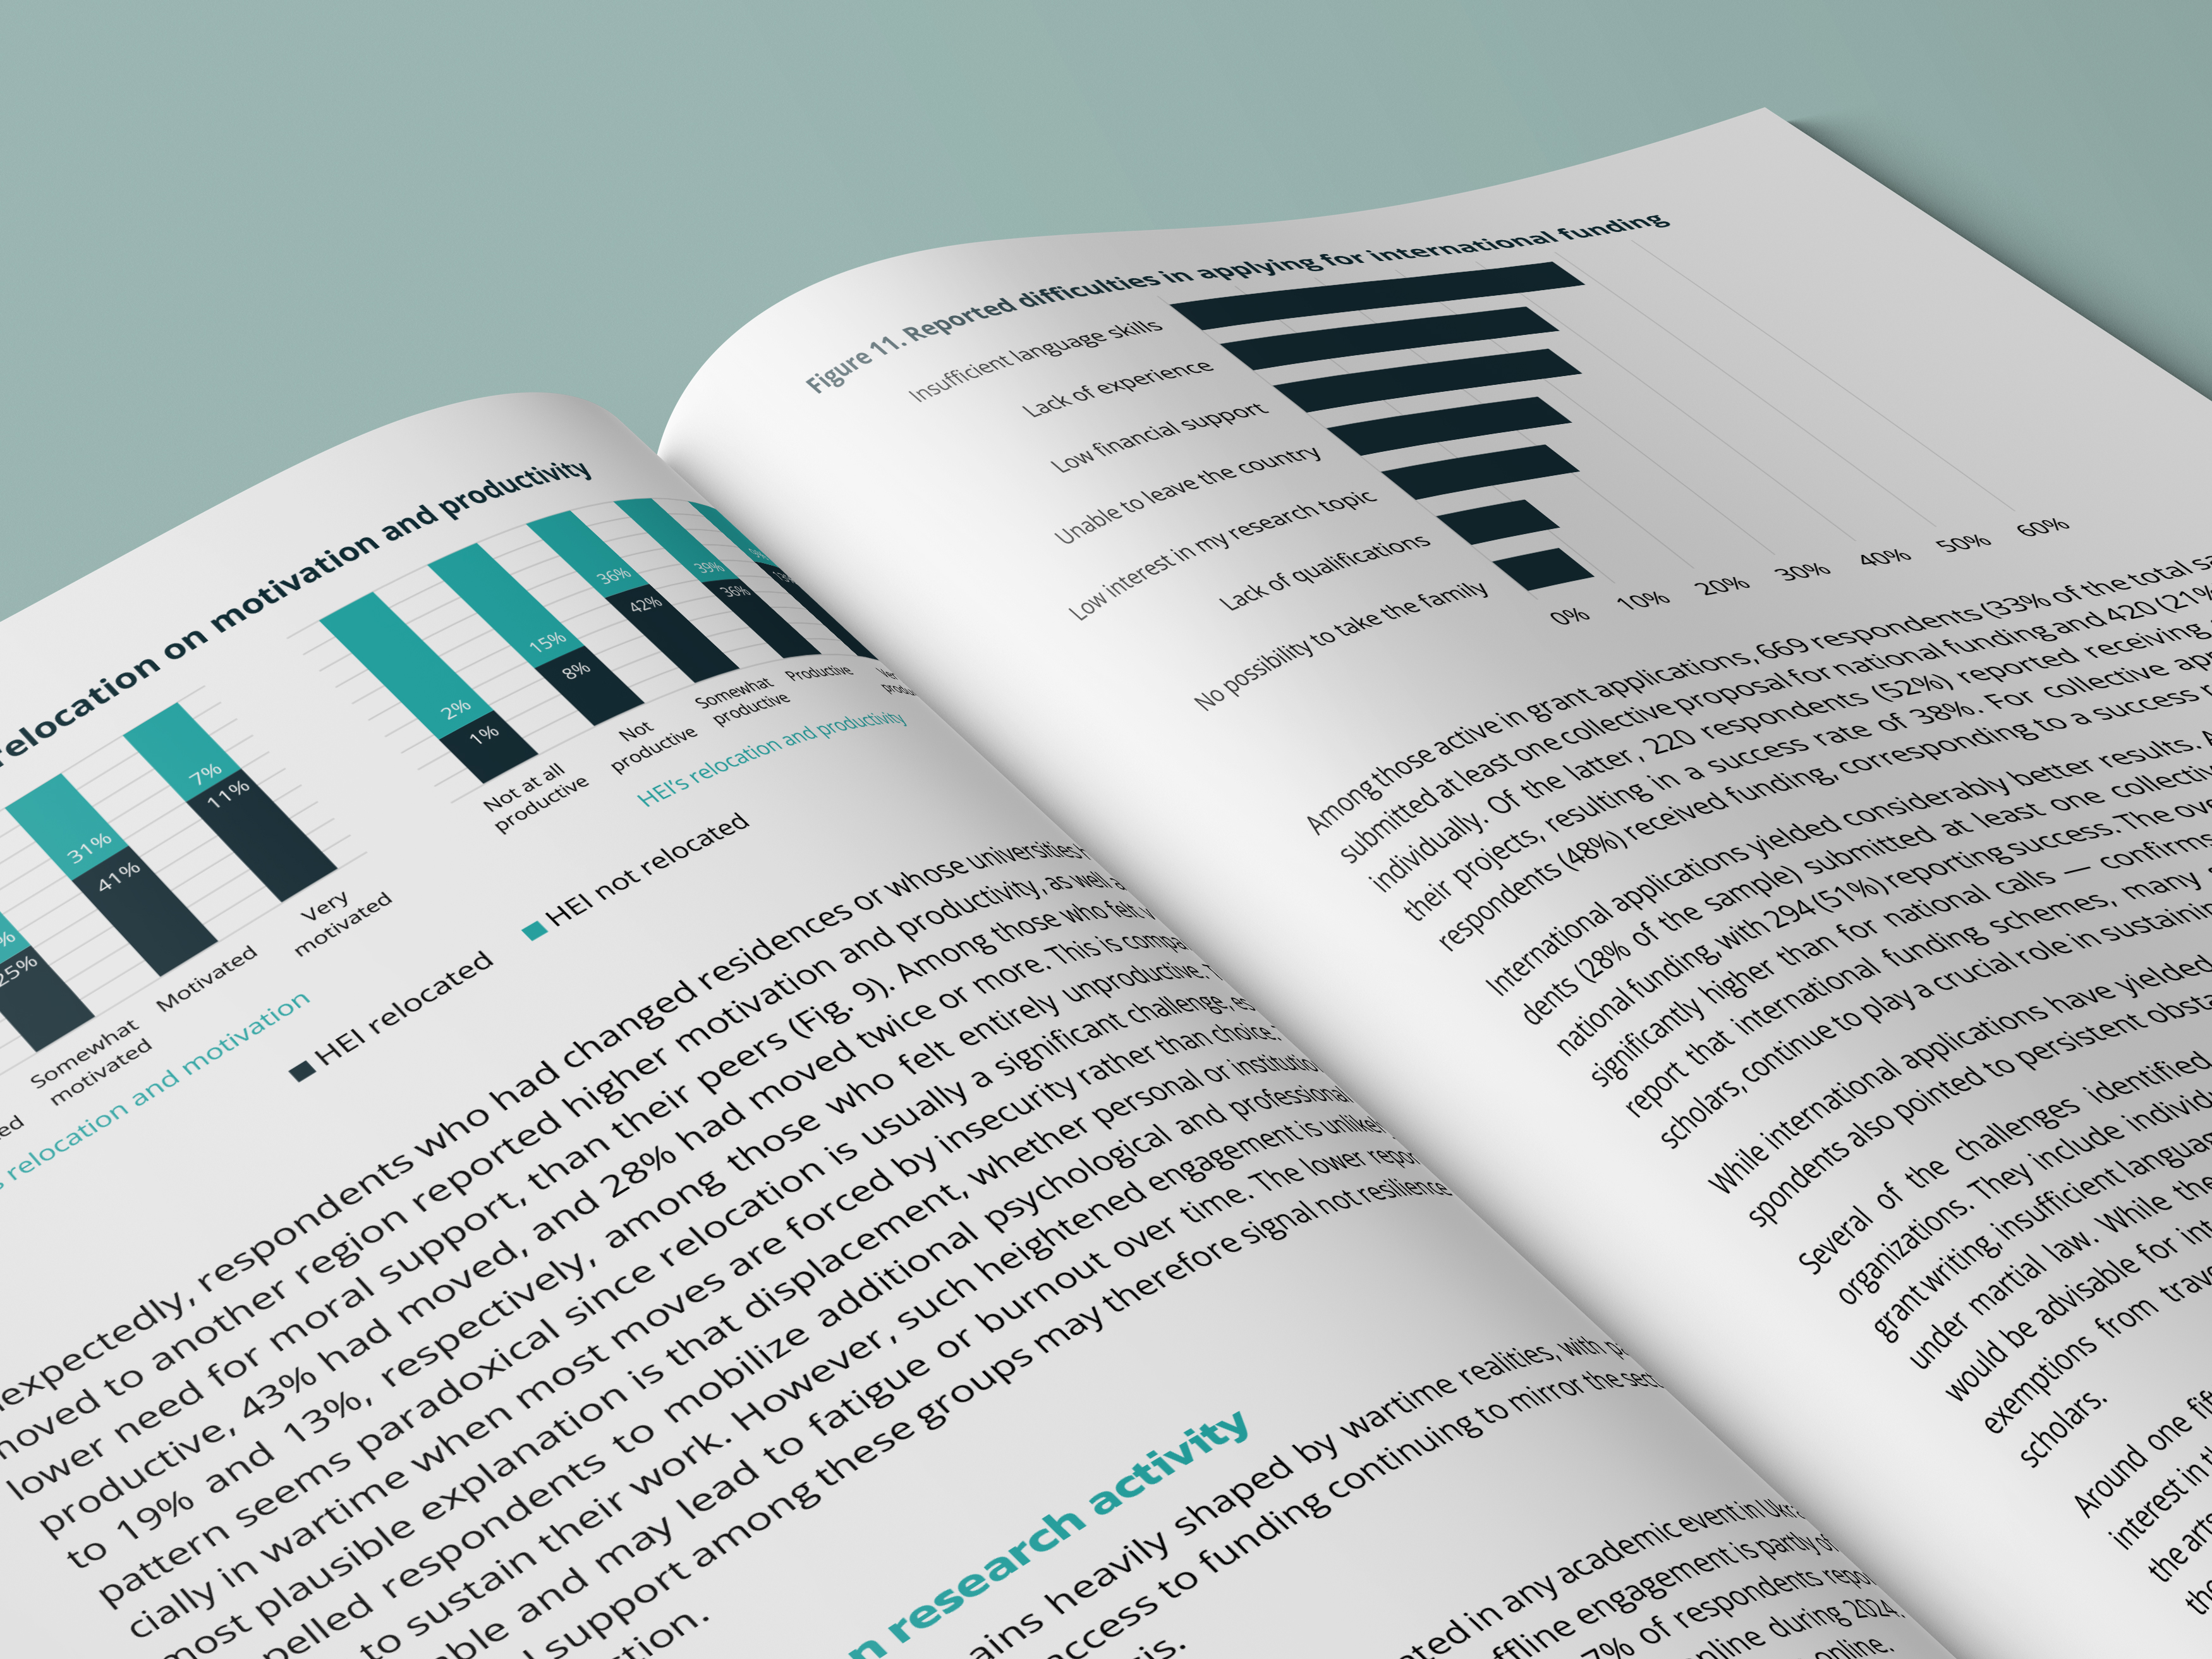
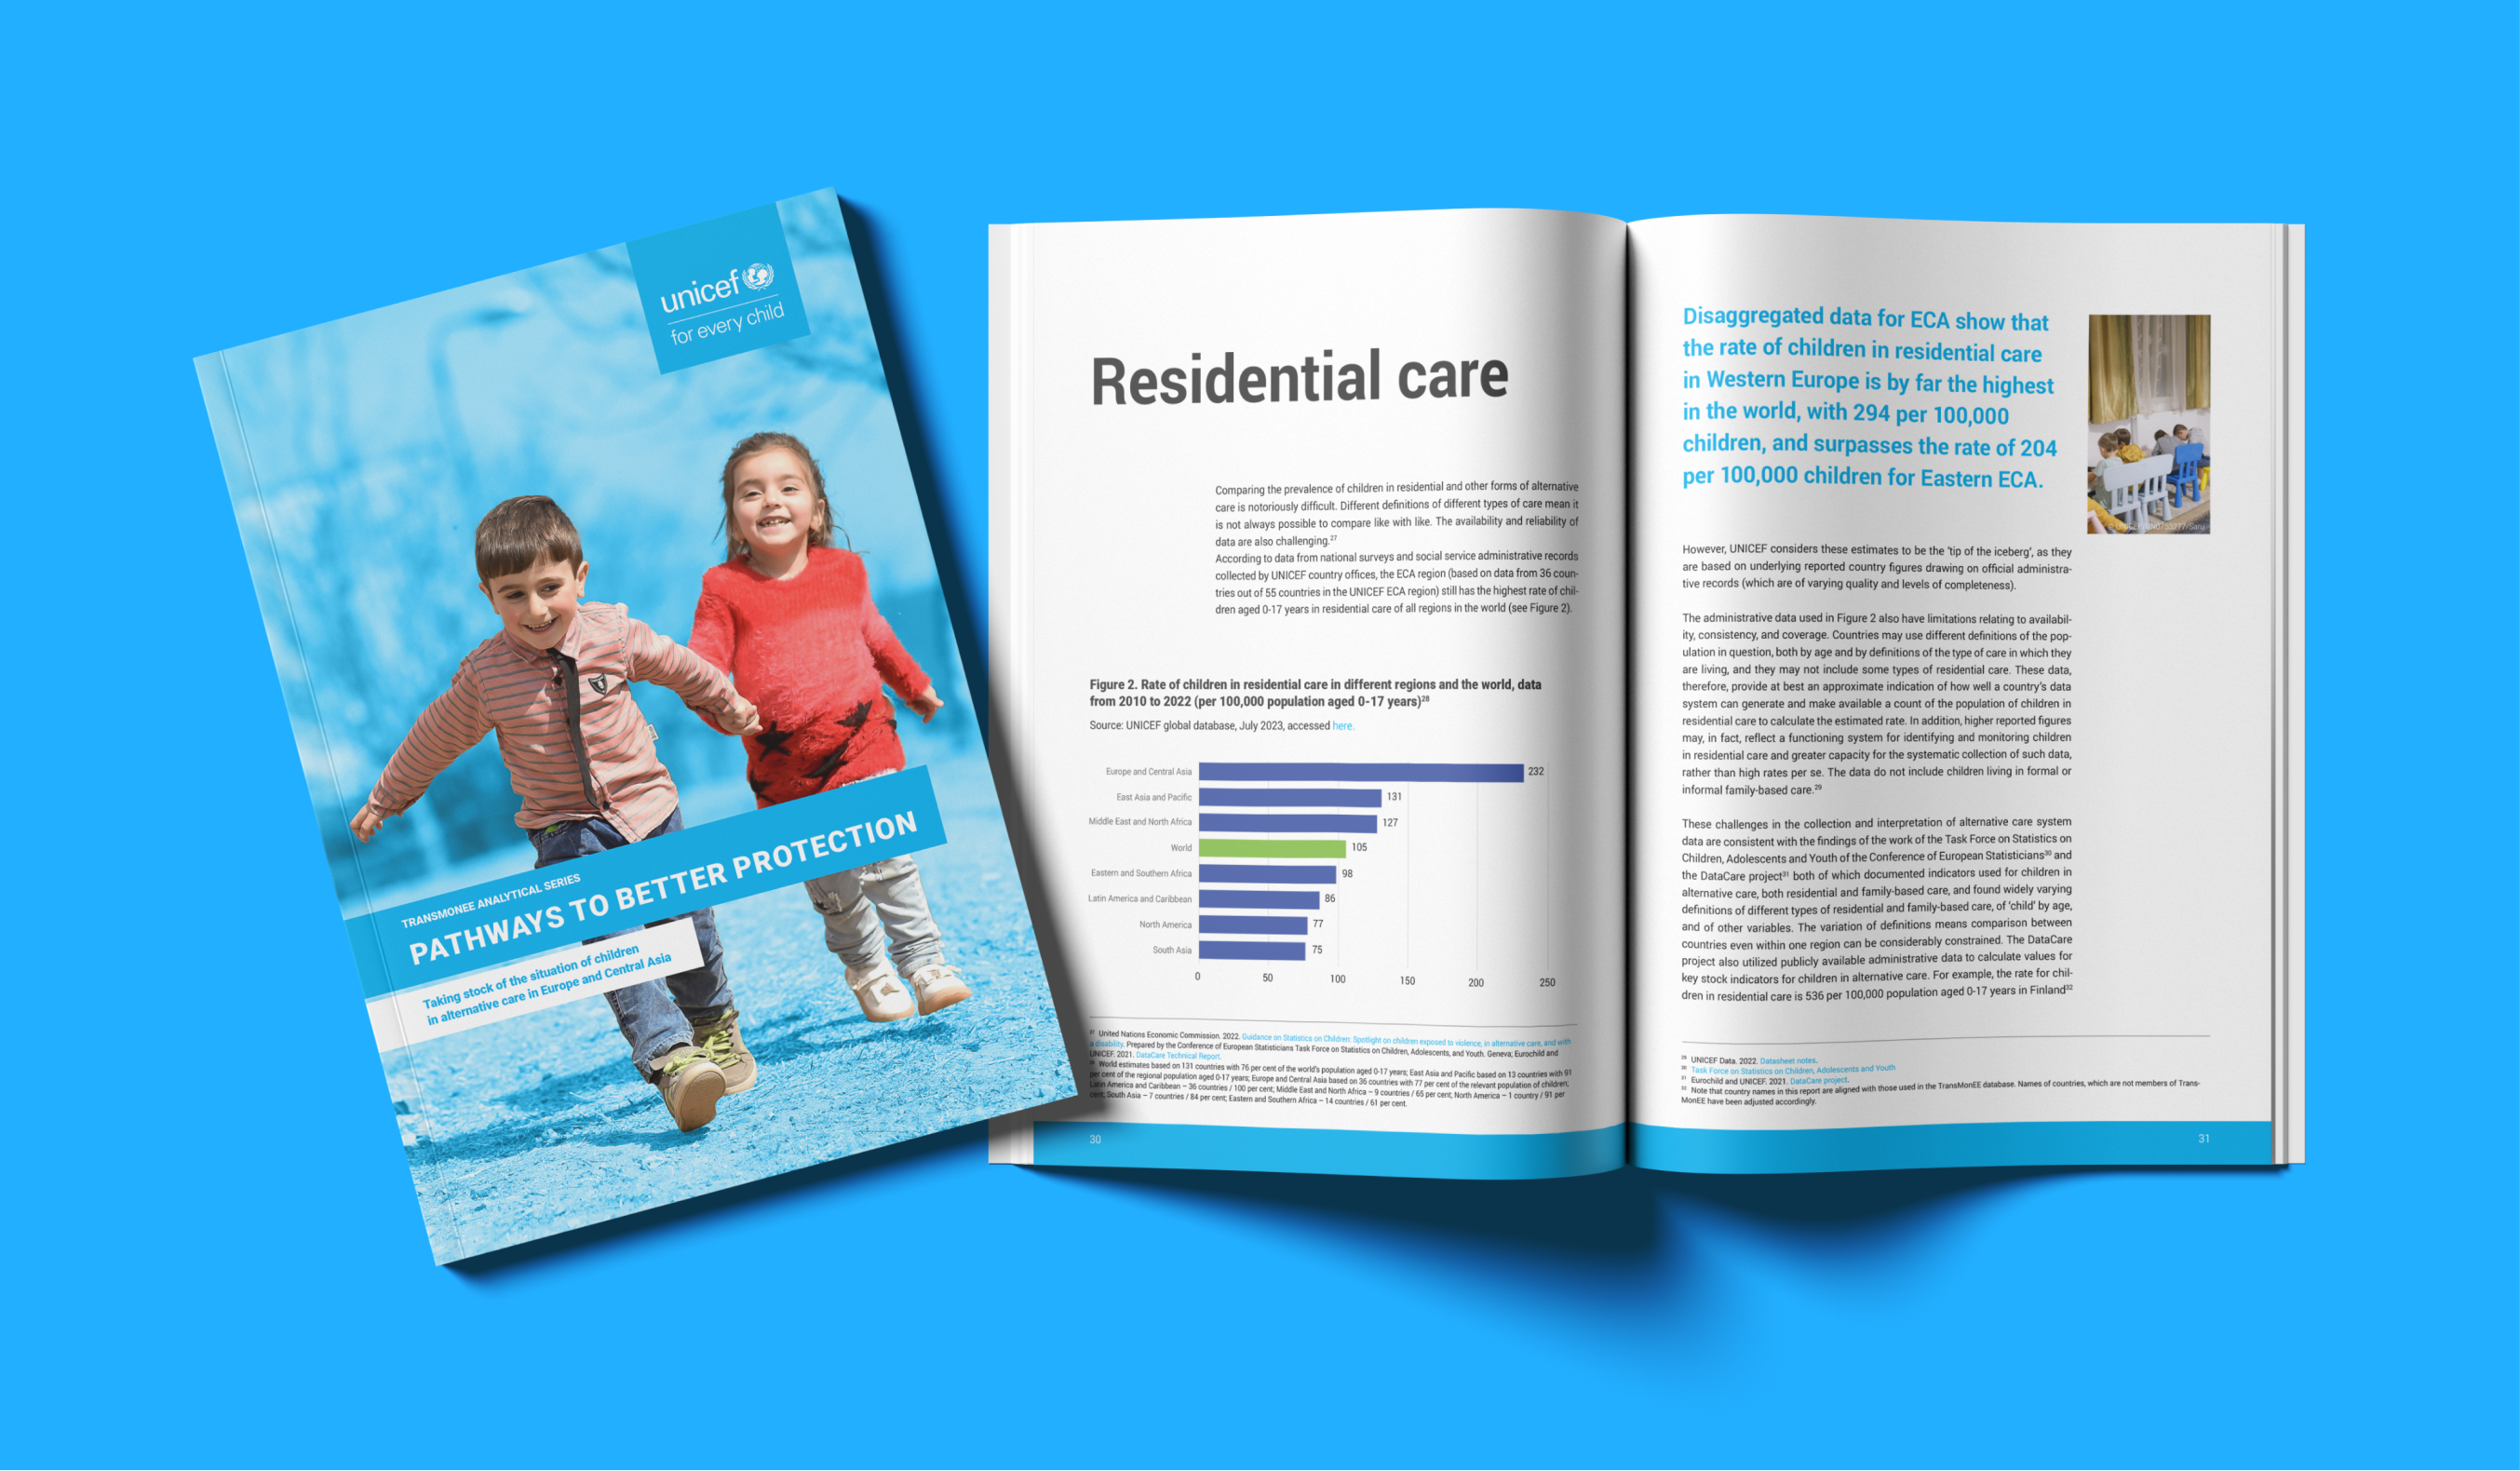
Open book showing two pages with data visualizations and text: left page has a bar chart titled 'HEI’s relocation and productivity' with colored bars comparing motivation levels of HEI relocated and not relocated groups; right page features a horizontal bar chart titled 'Figure 11. Reported difficulties in applying for international funding' listing reasons such as insufficient language skills, lack of experience, low financial support, and others, alongside dense paragraphs of explanatory text.
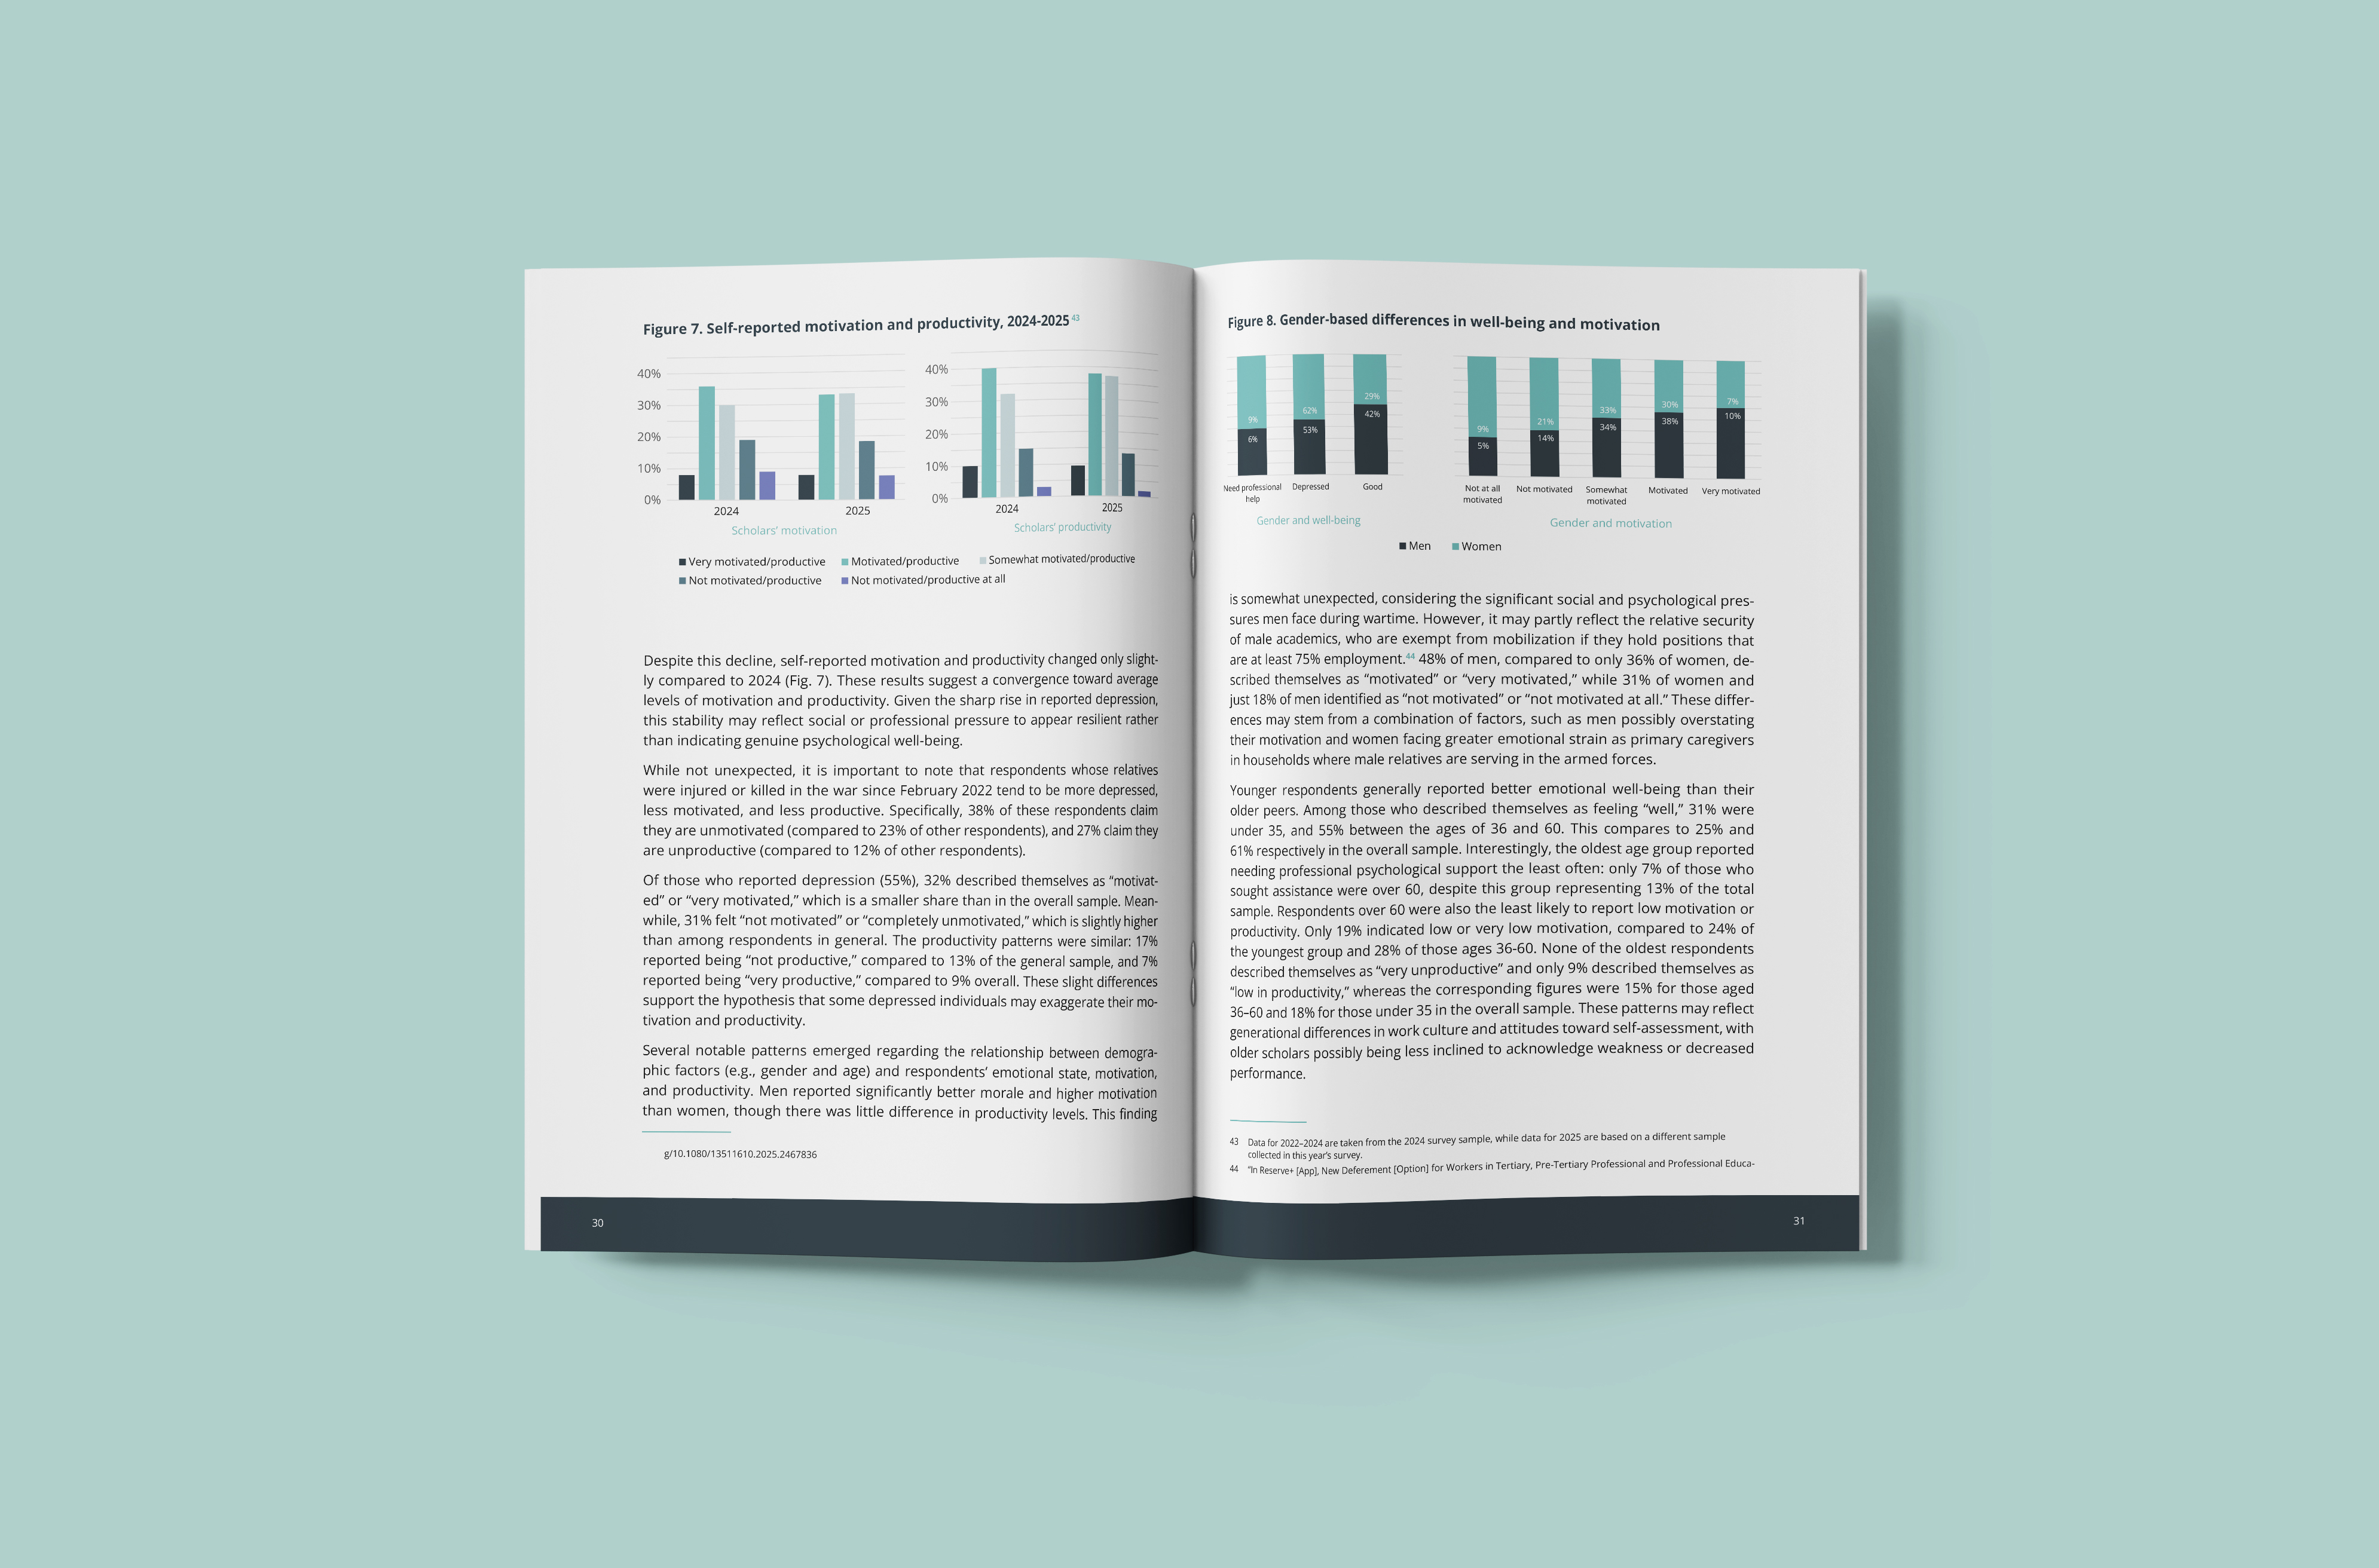
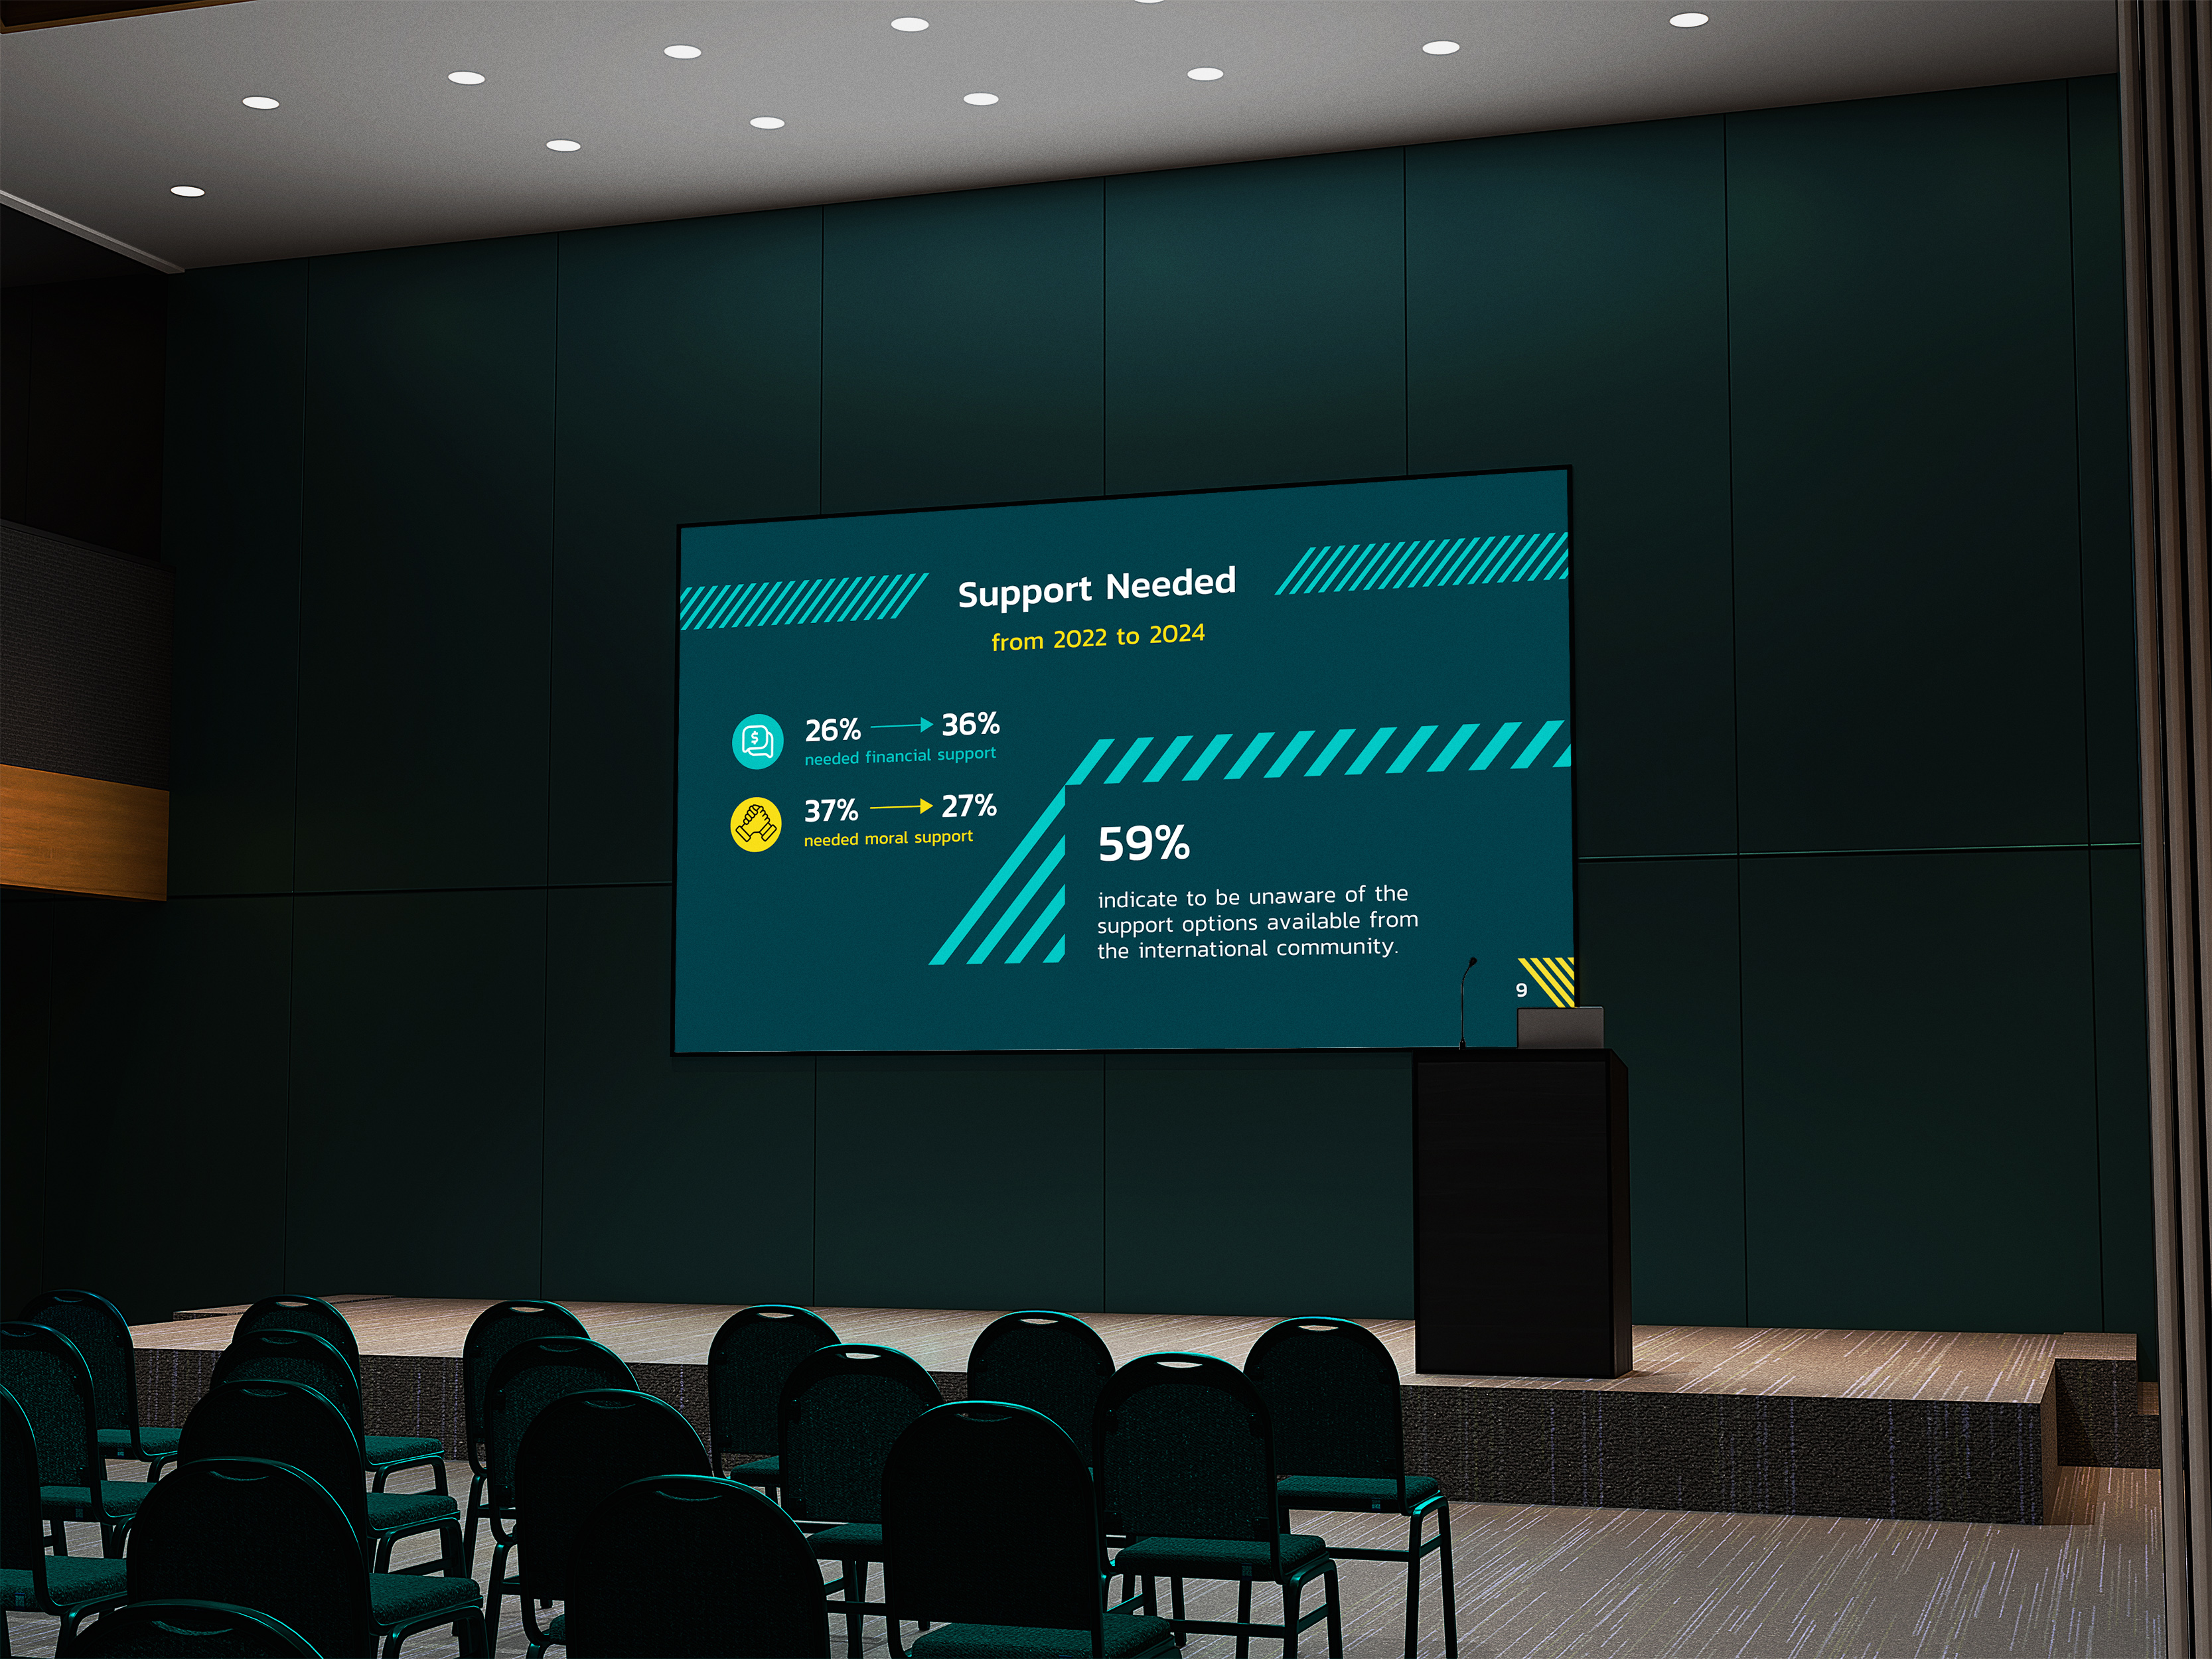
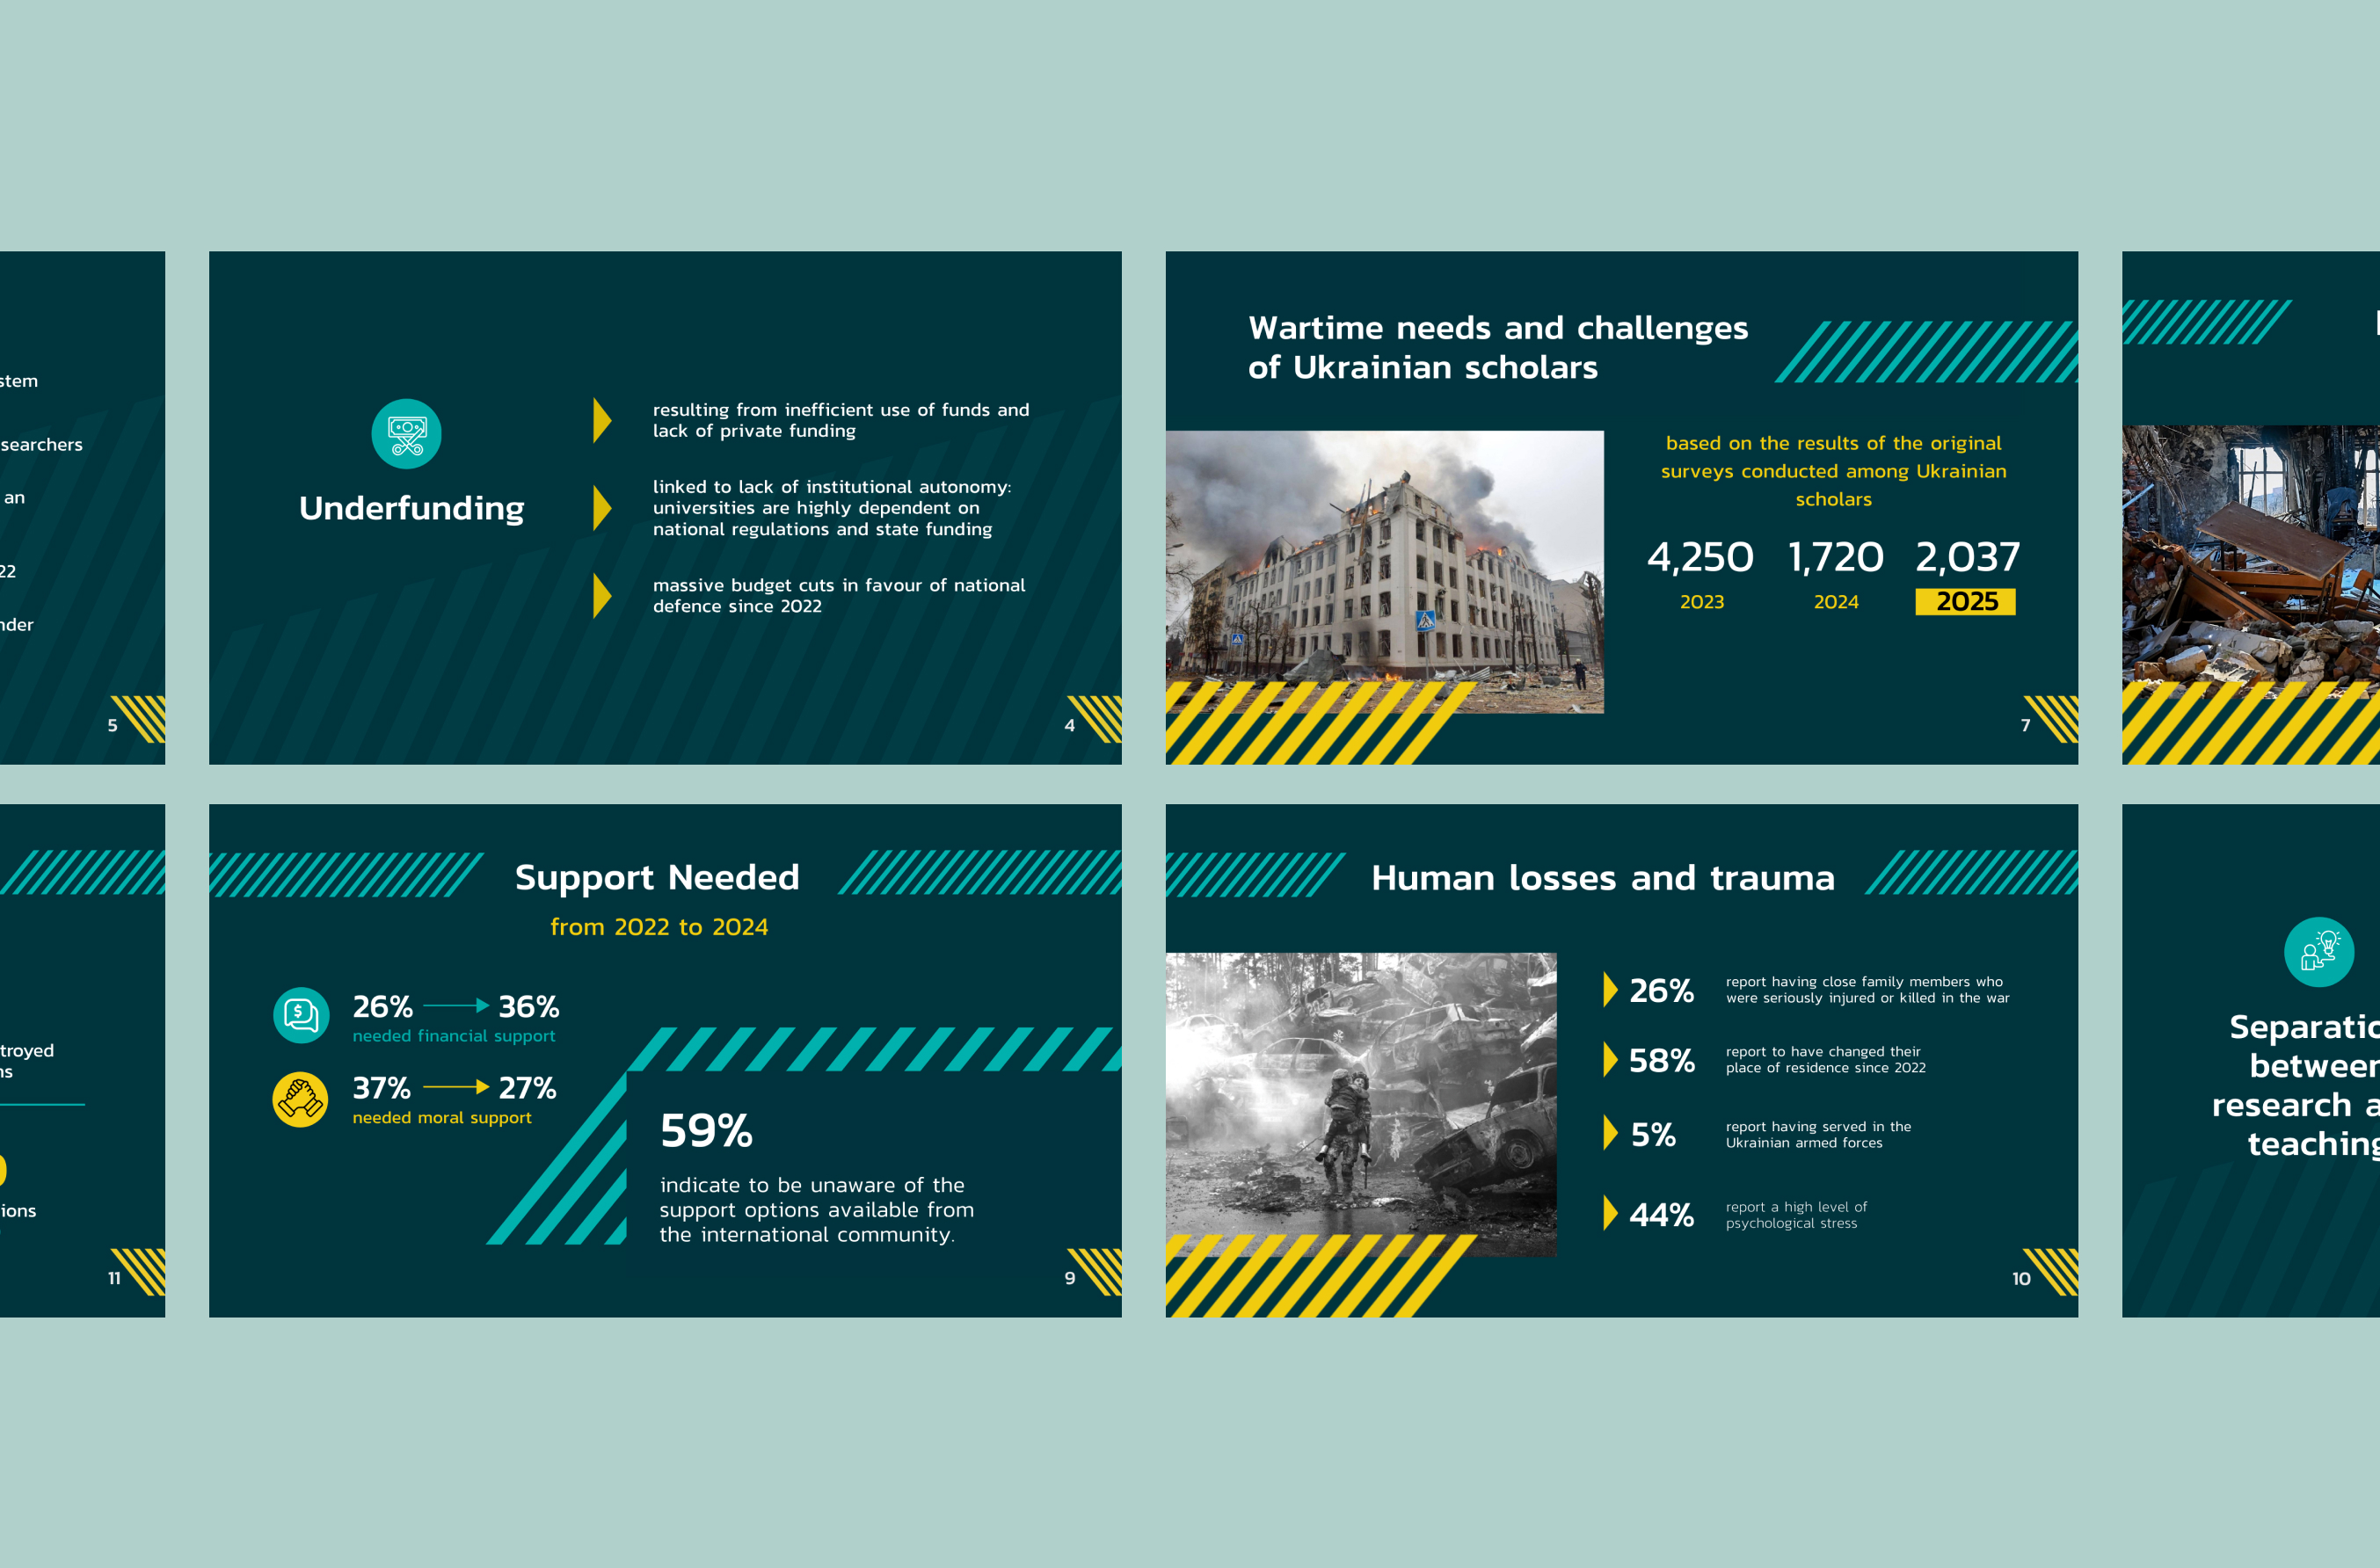
Open book showing two pages with text and charts about Ukraine's academic freedom amid the war. The left page features a heading, a descriptive paragraph, and a multi-line graph labeled 'Academic Freedom Index scores 1990-2024.' The right page has paragraphs of text discussing academic freedom challenges and a line graph titled 'Decline of Ukraine's Academic Freedom Index (AFI), 2021-2024,' showing a downward trend.Open book showing two pages with text and charts. Left page features two bar charts titled 'Figure 7. Self-reported motivation and productivity, 2024-2025' comparing scholars' motivation and productivity across 2024 and 2025, with categories for very motivated/productive, motivated/productive, somewhat motivated/productive, not motivated/productive, and not motivated/productive at all. Below is a detailed analysis text. Right page has a bar chart titled 'Figure 8. Gender-based differences in well-being and motivation' showing percentages for men and women on categories of need for professional help, depressed, good, not at all motivated, not motivated, somewhat motivated, motivated, and very motivated, with explanatory text below. Footer notes on both pages include page numbers 30 and 31.Conference room with a stage and empty chairs facing a large screen showing a presentation slide titled 'Support Needed from 2022 to 2024,' displaying statistics: 26% to 36% needed financial support, 37% to 27% needed moral support, and 59% unaware of support options from the international community.Infographic slides summarizing challenges faced by Ukrainian scholars during wartime, including underfunding with causes, survey results predicting scholar needs from 2023 to 2025, percentages on financial and moral support needed from 2022 to 2024, and human losses and trauma statistics with war-related photos of damaged buildings and a soldier among wreckage.

More cases in this category

Go to the category
Person with long dreadlocks wearing a red beanie and black shirt, smiling up at the camera while holding a tablet and stylus, surrounded by black and white letter cutouts on a light surface.

Need help designing a report? I can help you create reports of any complexity and develop all accompanying design materials.

Follow me on
Linkedin